Our Unified Observability & System Reliability solution empowers modern enterprises to reduce downtime and speed up incident resolution with real-time AI-driven insights, intelligent alerting, and automated root-cause-to-remediation workflows – all powered by GenAI.
OpsTree OLLY is used by India's most popular brand.
Why unified observability & SRE,
Is the need of the hour?
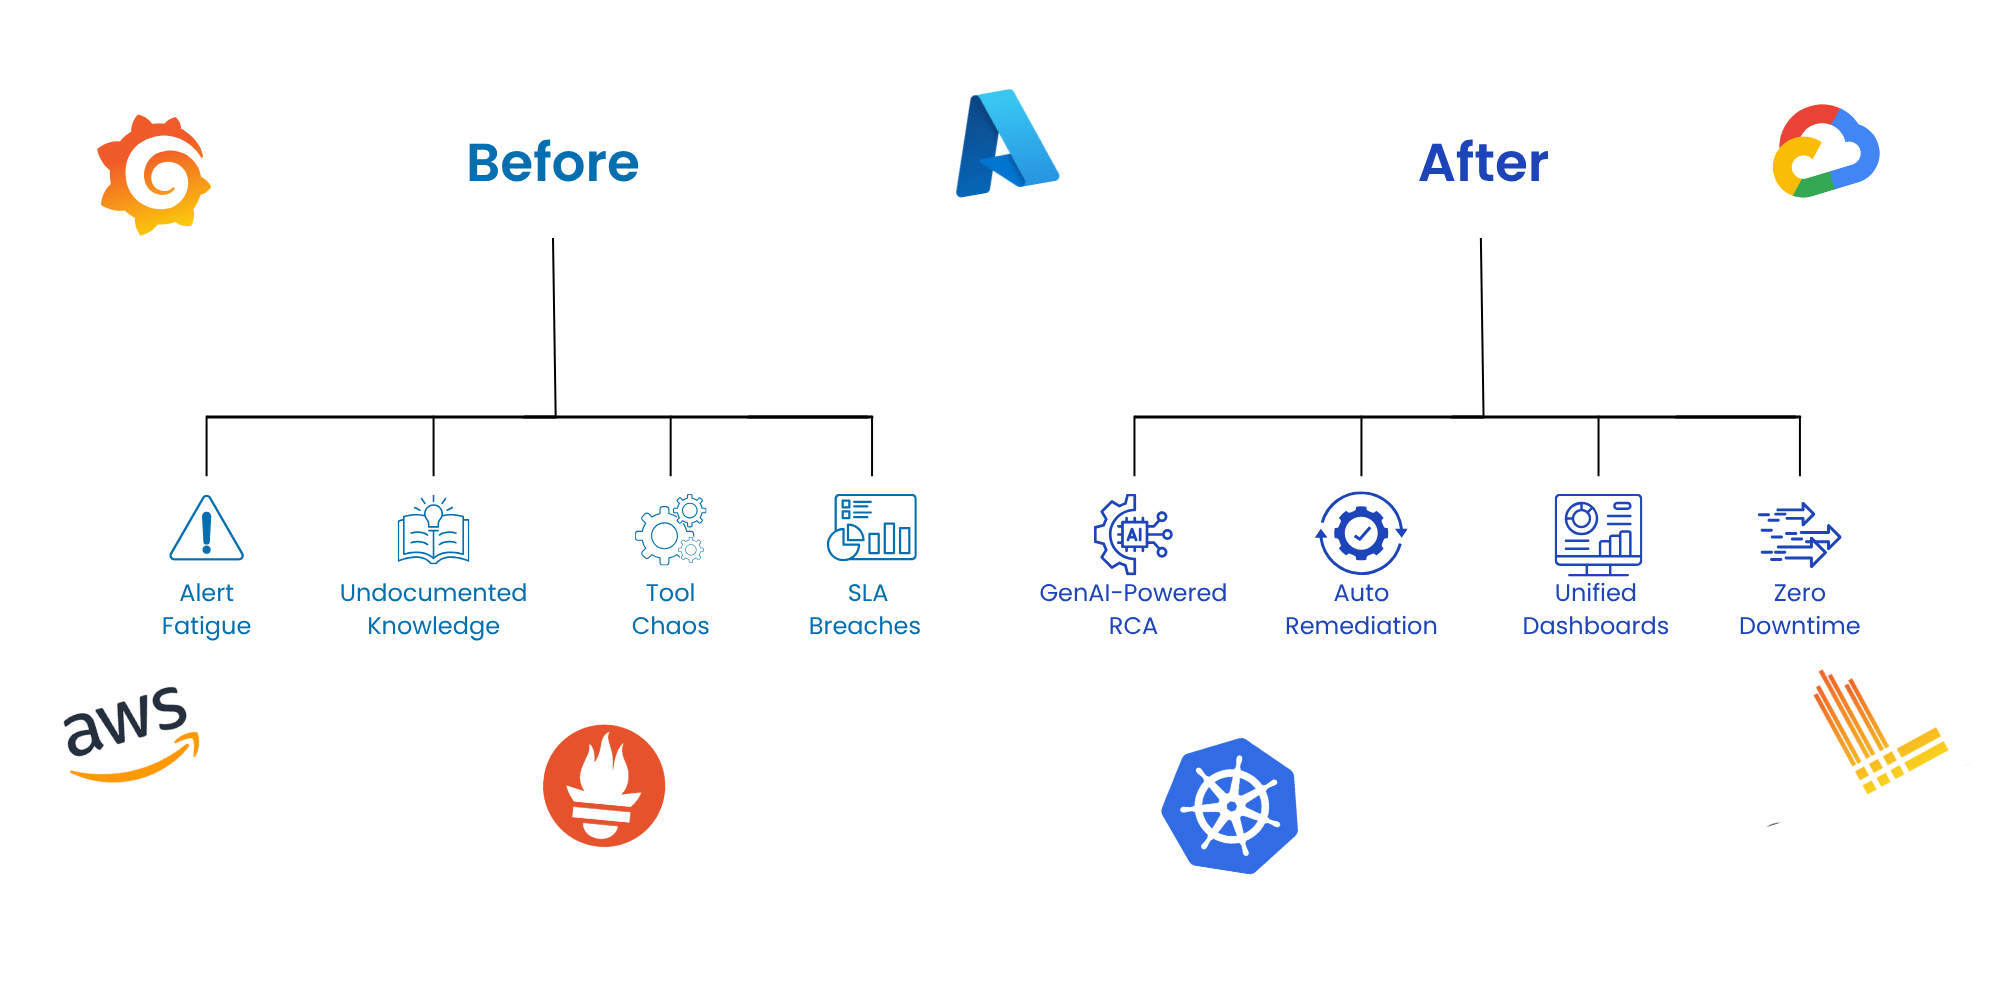
Unified Observability. AI-Simplified.
Tired of juggling dashboards? Our solution correlates logs, metrics, and traces, then uses GenAI to highlight what truly needs your attention.
Unified view across infra, applications, and user journeys
Pre-built dashboards using Grafana, Loki, Tempo, and Prometheus
Live correlation across metrics, logs, and traces in one place
Find the Root Cause. Instantly.
Forget manual troubleshooting. Our solution, powered with an AI engine auto-detects issues, traces them to the source, and even suggests or triggers fixes in real time.
AI-driven RCA based on telemetry and recent deployments
Instant mapping of impact across services and dependencies
Automated suggestions or rollbacks to resolve known issues
Resilience with Self-Healing Built In.
Our solution doesn’t just detect problems, it learns from patterns and remediates issues proactively, slashing downtime and improving uptime.
Auto-remediation for recurring incidents via policy triggers
Rollbacks and restarts handled based on known patterns
Real-world impact with our Observability & SRE solutions
Leading brands trust OpsTree


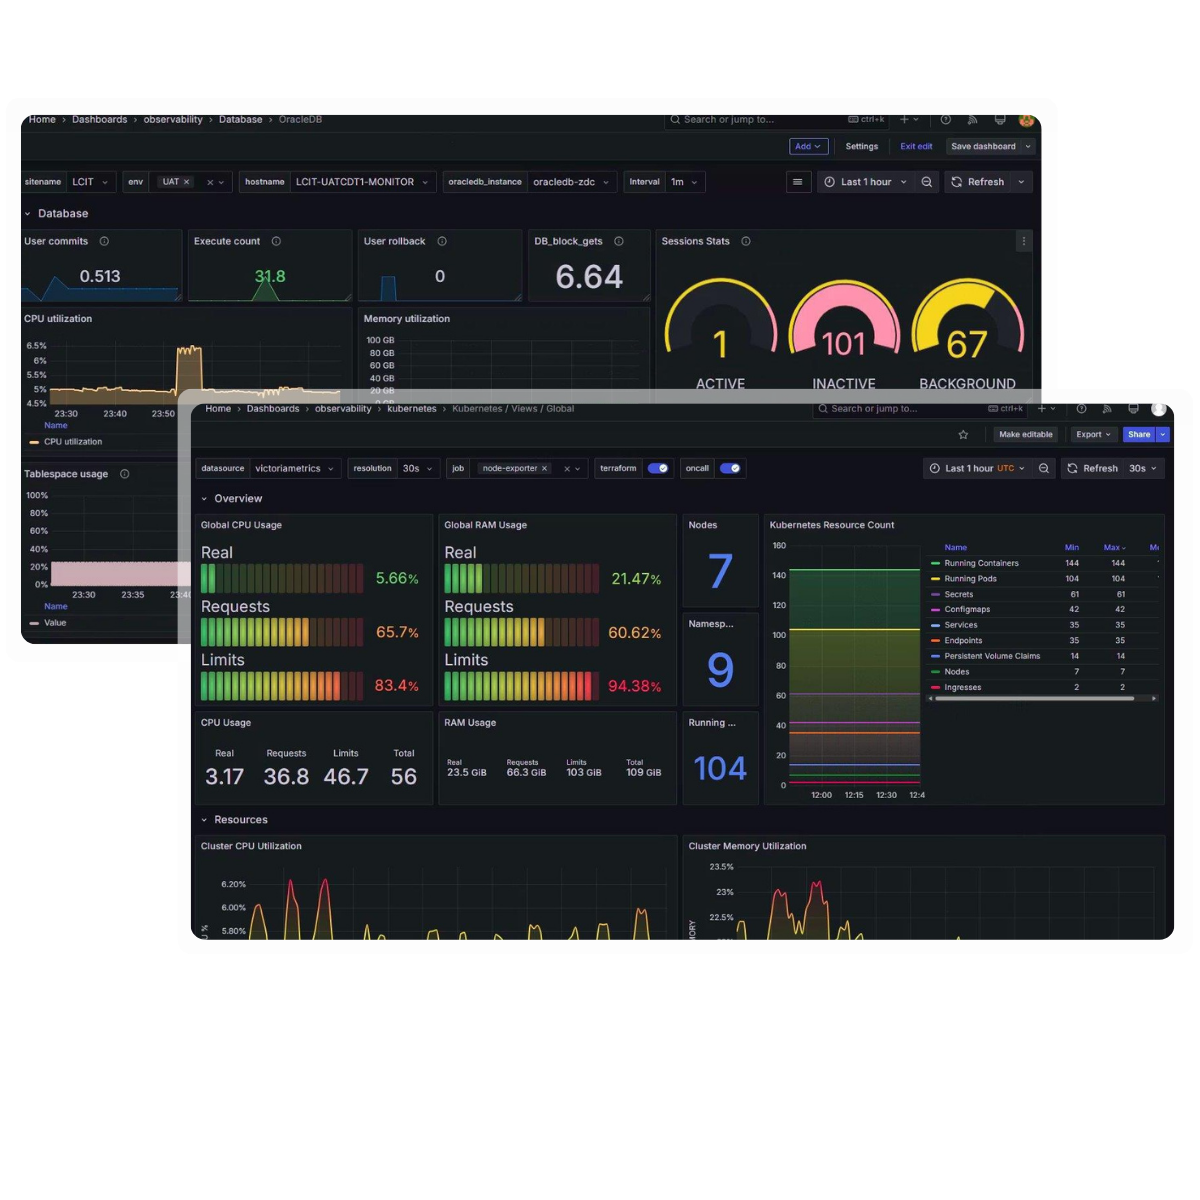
Visibility That Powers Site Reliability
Real dashboards. Real signals. Real-time decisions.
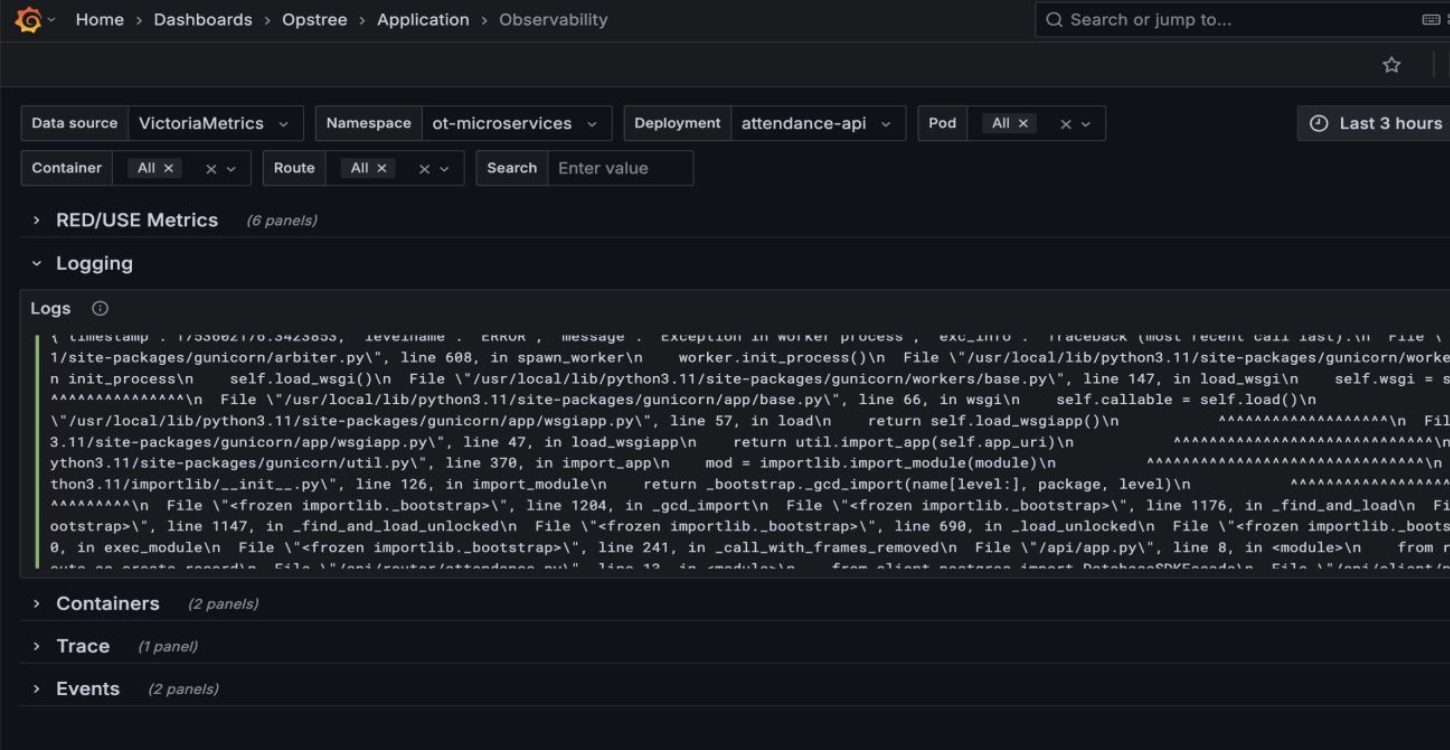
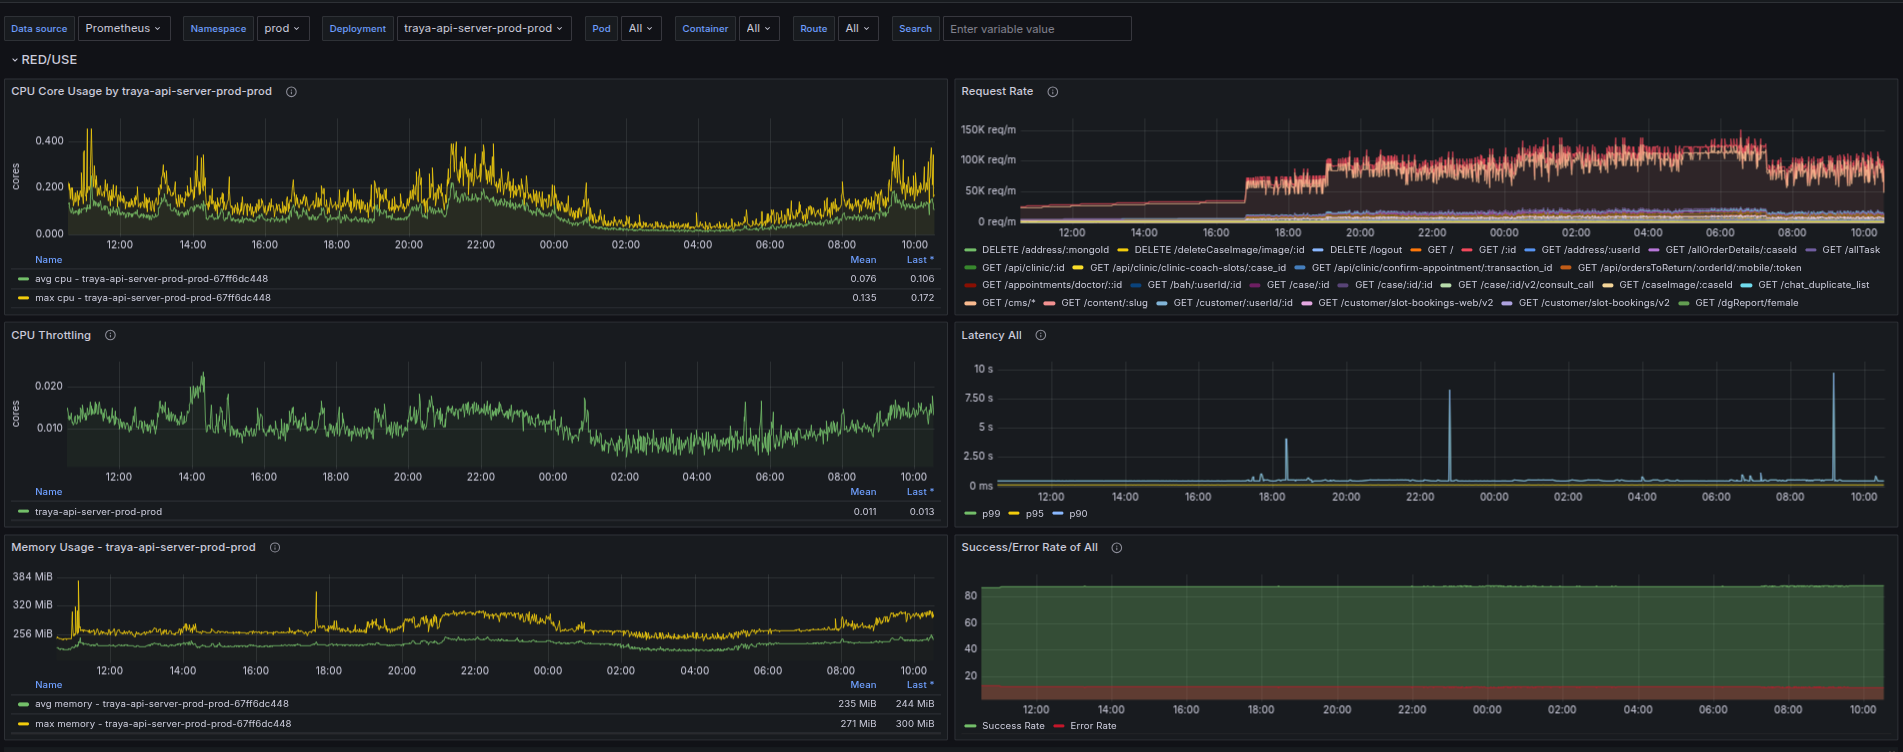
Service Health Dashboard
Live RED metrics with logs, traces, and infra KPIs — all unified in a single, intuitive view.
SLO & SLI Monitoring
Track service reliability, error budgets, and SLA
thresholds in real time.
Cost Observability Panel
Visualize cloud spend patterns, detect anomalies, and optimize cost efficiency across environments.
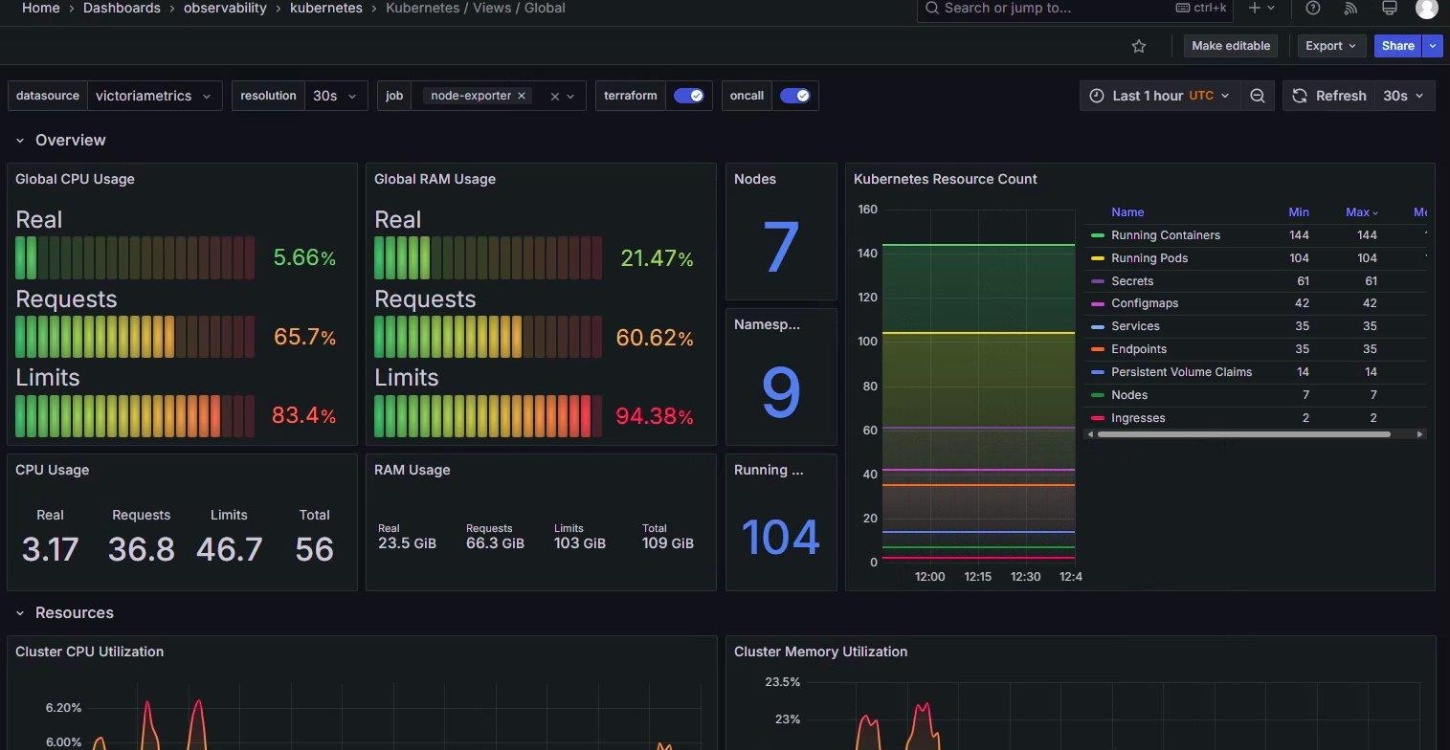
Kubernetes Infra View
Monitor pod health, node resource usage, and container lifecycle trends at a glance.
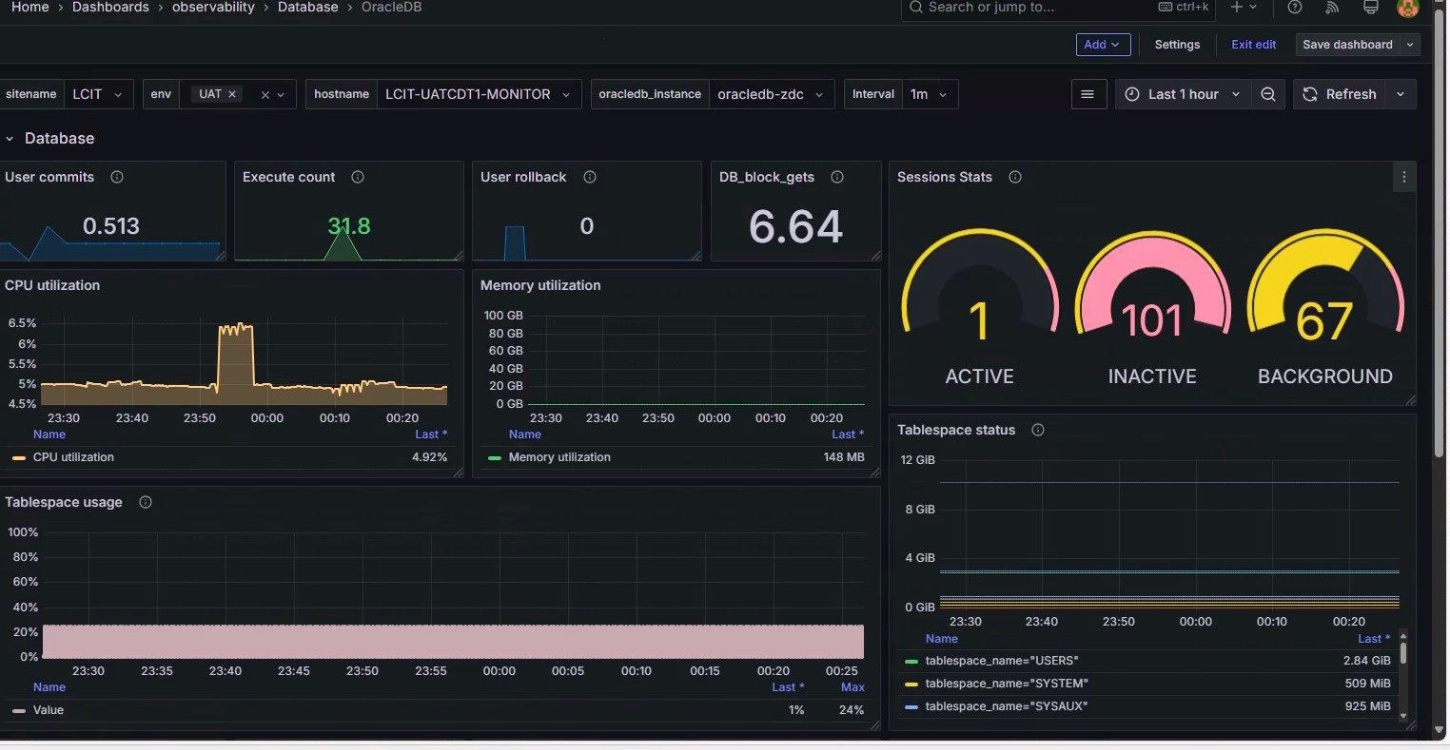
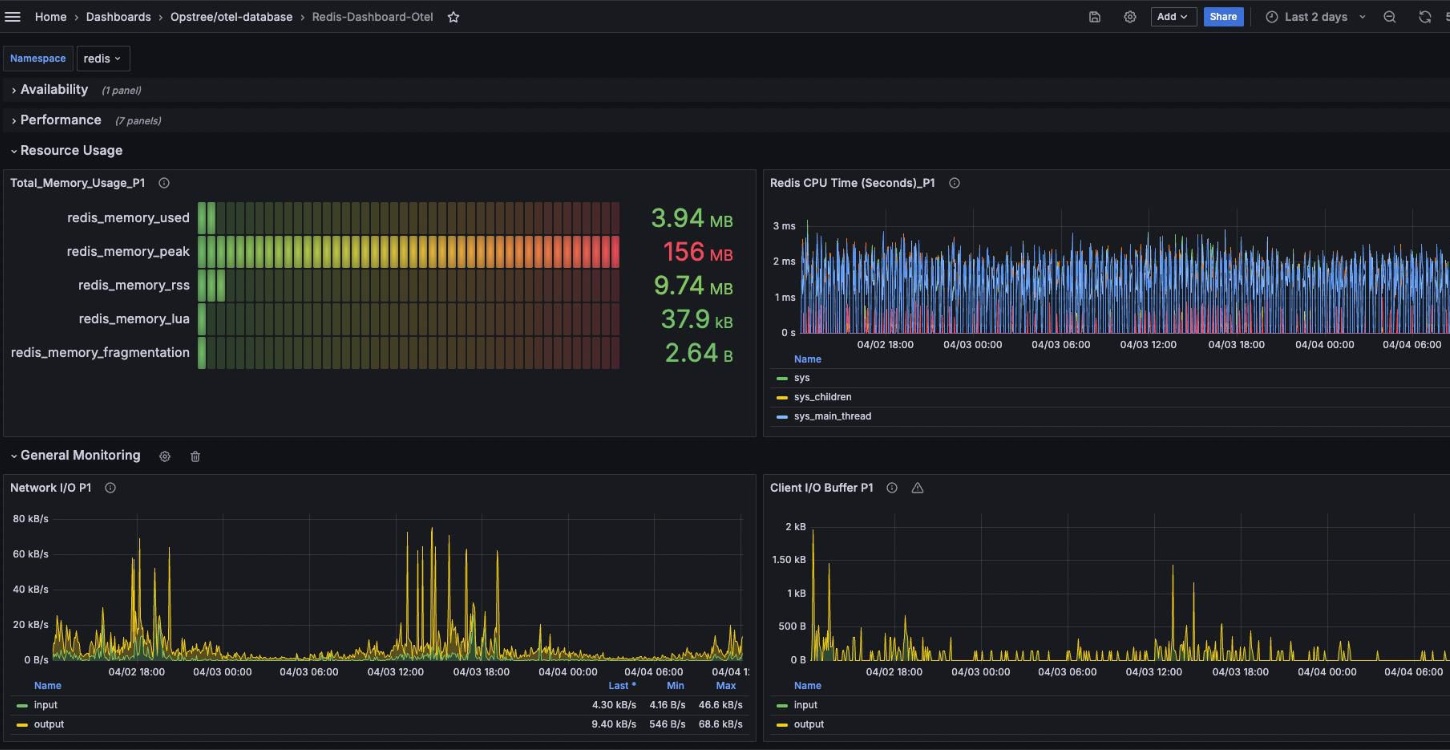
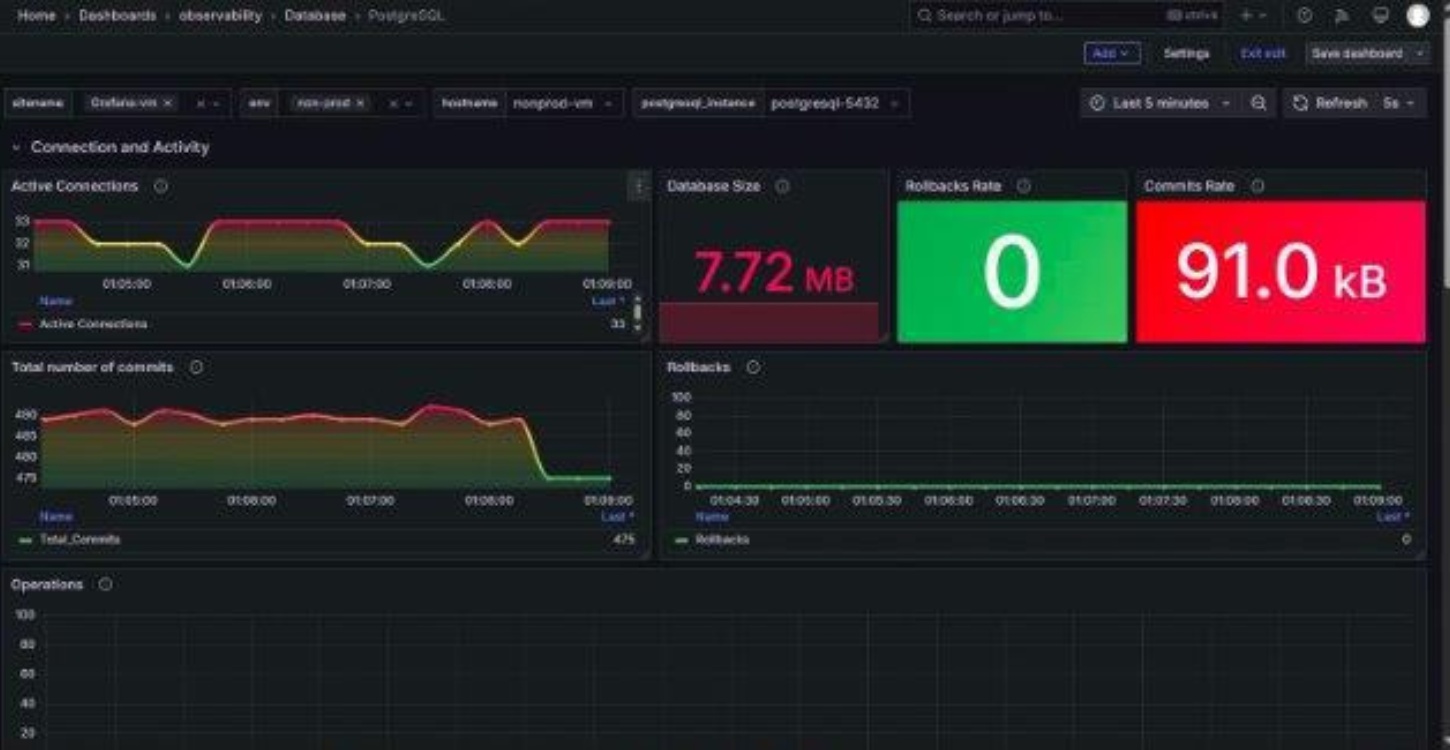
Database Insights (Postgres)
Track query latency, cache hits/misses, and connection metrics to ensure DB performance.
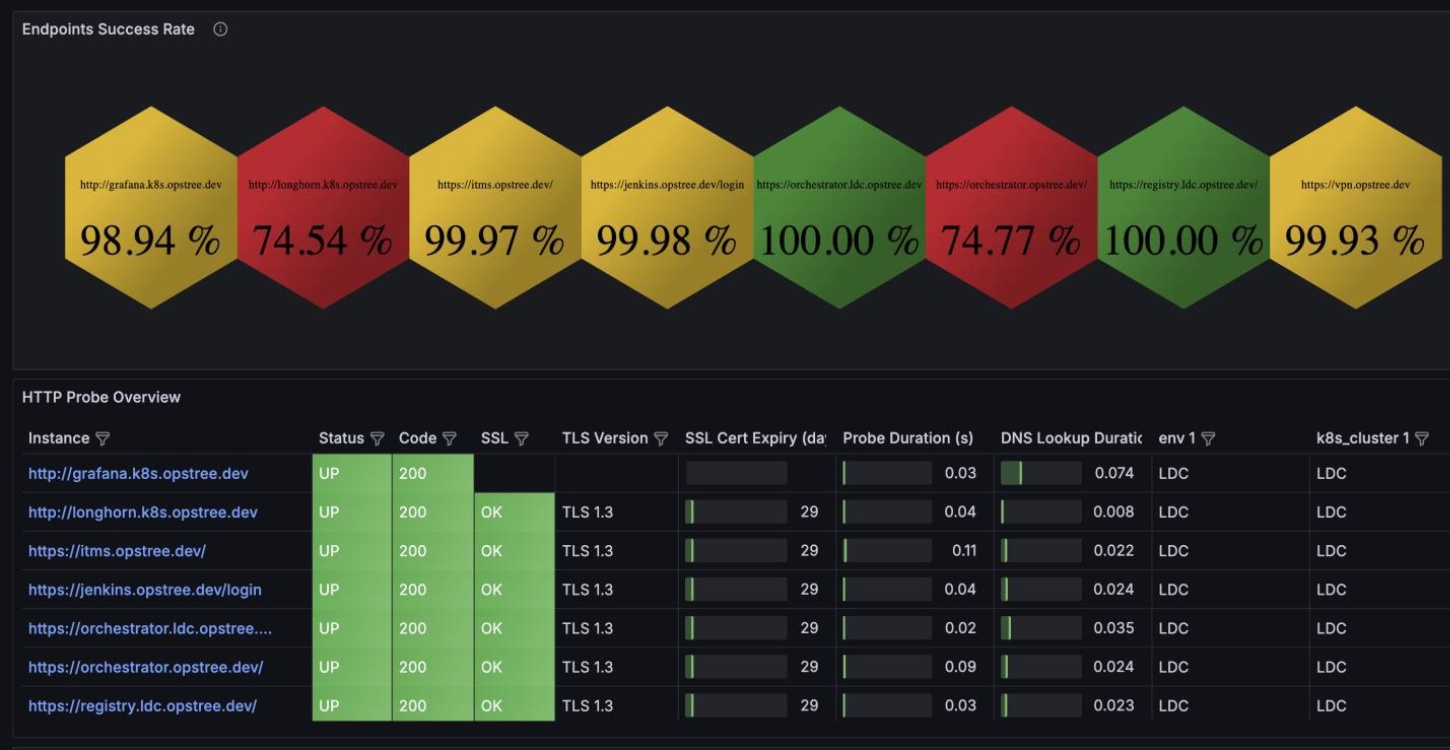
Middleware Health Snapshot
Stay ahead of SSL expiry, TLS versions, and middleware resource usage with clean visual panels.
Built to Work Where You Work


Designed for Modern SRE Teams
Shift from reactive Ops to predictable reliability
Our solution empowers Site Reliability Engineering (SRE) teams with the tools and intelligence to manage performance, prevent outages, and scale operations without the chaos.
Live SLO & SLI
Dashboards
Track availability, latency, and error rates across every critical service in real time.
Automated Remediation
Workflows
Let GenAI respond to known issues instantly, no more repeated manual fixes.
O11Y.AI
Blameless RCA &
Postmortems
Capture root causes and incident learnings to improve without finger-pointing.
Visibility from Infra
to Code
Monitor every layer - infra, apps, databases, middleware through one unified lens.
Insights & Innovations


Get a Custom Solution Walkthrough!
Let’s Plan Your Project
From ideation to completion, let’s make your dream a reality.
Frequently Asked Questions
What kind of data does the platform ingest?
Logs, metrics, traces, events, and deployment metadata across infra, apps, and services.
Does it resolve issues automatically?
Yes. For known patterns, it can roll back deployments, restart services, or trigger fixes without human input.
How does it identify the root cause?
It correlates telemetry with recent system changes and dependency graphs to isolate the true source of failure.
Can it learn from past incidents?
Yes. The system improves over time by learning which fixes worked and recognizing similar future patterns faster.
Will it work with our existing observability tools?
Yes. It integrates with standard telemetry sources and can sit on top of your current monitoring stack.