

Introduction
Grafana Pyroscope is a continuous profiling tool that helps monitor and optimize application performance. It continuously collects profiling data from running applications, such as CPU, memory, and execution time, to identify performance bottlenecks. By integrating with Grafana, it provides clear visualizations that help developers and DevOps engineers analyze application performance and troubleshoot issues more efficiently.
The Metric Blind Spot: Why Prometheus Isn’t Enough
Standard monitoring tools like Prometheus and Grafana are excellent at telling you *that* something is wrong high CPU, high memory, elevated latency. What they can’t tell you is why: which specific function, which line of code, which allocation is responsible.
That gap is what continuous profiling closes. Grafana Pyroscope continuously samples running applications and produces function-level, line-level visibility into CPU time and memory allocation turning a vague “CPU usage is high” alert into “this function, at this line, is the cause.”
| What Metrics Tell You | What Profiling Proves |
|---|---|
| CPU usage is high | Which function is consuming the CPU |
| Memory usage is high | Which function is allocating the memory |
| API latency is elevated | Which code path is slow, down to the line |
| Something is wrong | Exactly what and where |
Pyroscope Architecture Diagram
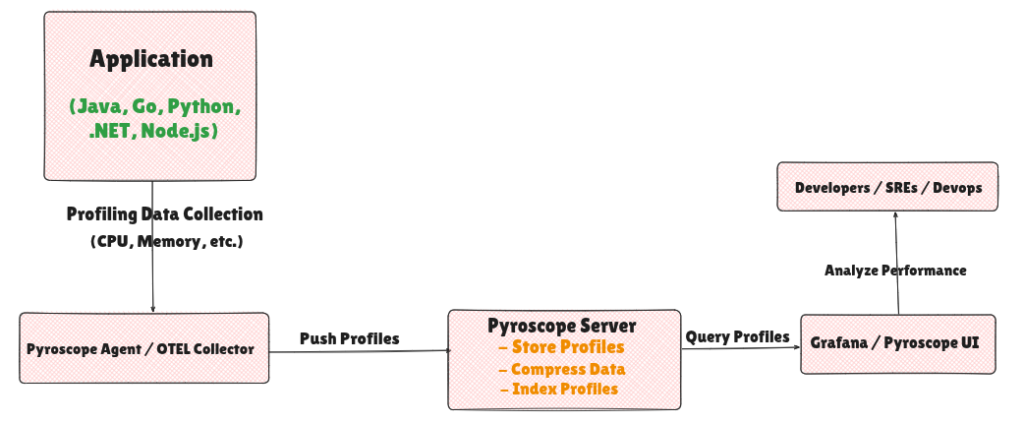
The diagram below shows the overall architecture of Pyroscope and the flow of profiling data from applications to Grafana. It highlights the main components involved in collecting, storing and analyzing profiling data.
Architecture Flow
- Applications generate profiling data.
- The Profile Collection Layer collects and sends the data to the Pyroscope Server.
- The Pyroscope Server stores and processes the profiling data.
- Grafana displays the profiles for analysis by Developers and DevOps engineers.
Instrumentation Methods
Pyroscope supports multiple methods to collect profiling data. The collection method depends on your application and deployment environment
| Method | How It Works | Best For |
|---|---|---|
| SDK-Based (Push Model) | The application uses the Pyroscope SDK to send profiling data directly to the Pyroscope Server. | Applications where the SDK can be added. |
| Grafana Alloy (Pull Model) | Grafana Alloy collects profiling data from applications and forwards it to the Pyroscope Server. | Kubernetes and centralized profile collection. |
| OpenTelemetry (OTLP) | OpenTelemetry collects and exports profiling data to the Pyroscope Server using OTLP. | Environments already using OpenTelemetry. |
eBPF vs. SDK: The Memory Trap
- Pyroscope supports two profiling methods in Kubernetes: **eBPF (via Grafana Alloy)** and **SDK-based push profiling**.
- Choosing the right method is important because the wrong approach can prevent **memory profiling data from being collected**.
The Kernel Boundary Limitation
- eBPF profiling with Alloy is easy to deploy because it requires no code changes and can cover the entire Kubernetes cluster.
- It mainly collects CPU profiling data at the kernel level.
- It cannot directly track memory usage, lock contention or garbage collection (GC) inside the application.
| Point | Explanation |
|---|---|
| What eBPF supports | CPU profiling only |
| What eBPF does not support | Memory, lock, and contention profiling |
| If your dashboard shows CPU but memory is empty | This is expected behavior, not a bug |
| Can this be fixed with config? | No — this is a fundamental eBPF limitation, not a settings issue. |
| How to get memory profiling | Switch to SDK-based (push model) — requires adding the SDK to the application |
Implementation
This section covers the steps to set up Pyroscope profiling (server + SDK-based application profiling) in a Kubernetes environment.
Prerequisites:
| Requirement | Details |
|---|---|
| Kubernetes cluster | A running cluster with kubectl access |
| Helm | Helm v3+ installed (helm version to check) |
| Namespace | A namespace to deploy Pyroscope into (e.g. observability) — can be created automatically during install |
| Grafana | An existing Grafana instance in the cluster (or accessible externally) to visualize profiling data |
| Application access | For SDK-based profiling: access to the target application’s codebase (e.g. REMS) and its requirements.txt / equivalent dependency file |
| Network | The application and the Pyroscope server must be able to reach each other over the cluster network |
Note: OTel is not a prerequisite for this POC — the data flow is App SDK → Pyroscope server directly (port 4040). No OTel Collector pipeline is involved in between.
Chart location:
https://github.com/bhanukumari/profilling-repo
The chart includes the following files:
| File | Purpose |
|---|---|
| Chart.yaml | Declares the official Grafana Pyroscope chart as a dependency |
| values.yaml | Configuration for the deployment (single-binary mode, resources, persistence, ingress) |
1. Clone the repo and go to the Pyroscope chart directory
git clone https://github.com/OT-COE/o11y.git
cd o11y/Installation/K8s/charts/observability/profiling
2. Pull the official Pyroscope chart as a dependency
helm dependency update
3. Install into the observability namespace
helm install pyroscope-server . -n observability –create-namespace
4. Verify the pod and service came up
kubectl get pods -n observability | grep pyroscope

kubectl get svc –n observability | grep pyroscope

Endpoint
Any application instrumented with the SDK sends profiles to:
http://pyroscope-server.observability.svc.cluster.local:4040
Note: All environment-specific config (resources, ingress, persistence) lives in values.yaml customize the deployment there instead of editing the chart directly.
Enabling Profiling on an Application (SDK-Based, for CPU + Memory)
- This is where Pyroscope becomes more than just a deployed tool and starts providing **real profiling insights**.
- The basic setup is simple: **install the SDK, initialize it, and start profiling the application**.
- You can use it to profile different workloads, such as **CPU-intensive and memory-intensive applications**.
Step 1: Install the SDK
pip install pyroscope-io
Step 2: Create a file named app.py
Create a new file called app.py in your project and paste the following code into it:
# app.py

import os
import time
import pyroscope


# 1. Initialize the SDK — do this once, at process startup

pyroscope.configure(
    application_name = "reporting-service.python.app",
    server_address    = "http://pyroscope-server.observability.svc.cluster.local:4040",
    sample_rate       = 100,             # samples per second

    # --- CPU profiling ---
    cpu_enabled       = True,            # turn CPU profiling on
    oncpu             = True,            # only count actual CPU time (ignore idle/wait time)
    gil_only          = True,            # only sample threads holding the GIL (relevant to Python's threading model)

    # --- Memory profiling ---
    mem_enabled       = True,            # turn memory/heap profiling on (OFF by default!)
    mem_max_nframe    = 128,             # how many stack frames to capture per allocation
    mem_heap_sample_size = 512 * 1024,   # sample roughly every 512 KB allocated (lower = more detail, more overhead)

    detect_subprocesses = False,         # set True only if this process spawns child workers you also want profiled

    tags = {
        "env":     os.getenv("ENV", "poc"),
        "region":  "in-noida",
    },
)


# 2. A CPU-heavy function — tag it so it's filterable in Grafana

def cpu_intensive_task(n=2_000_000):
    with pyroscope.tag_wrapper({"workload": "cpu_bound"}):
        total = 0
        for i in range(n):
            total += i * i
        return total


# 3. A memory-heavy function — allocates and holds a large list

def memory_intensive_task(size_mb=50):
    with pyroscope.tag_wrapper({"workload": "memory_bound"}):
        # roughly size_mb worth of integers
        data = [0] * (size_mb * 1_000_000 // 8)

        time.sleep(2)   # hold the allocation so it's visible in a sample window

        return len(data)


if __name__ == "__main__":
    while True:
        cpu_intensive_task()
        memory_intensive_task()
        time.sleep(1)
What the Code Is Doing
- pyroscope.configure(…) — Runs once when the application starts. It defines the Pyroscope server address and the application name shown in Grafana.
- cpu_enabled=True — Enables CPU profiling.
- mem_enabled=True — Enables memory profiling. It is disabled by default, so it must be enabled explicitly.
- cpu_intensive_task() — Runs a CPU-heavy loop to generate CPU profiling data.
- memory_intensive_task() — Allocates a large amount of memory to generate memory profiling data.
- tag_wrapper({…}) — Adds labels to the profiling data, making it easier to identify and filter CPU and memory workloads in Grafana.
- while True loop — Continuously runs both functions so that profiling data is collected and sent to Pyroscope continuously.
What this achieves: a running Python app that automatically sends its own CPU and memory usage to the Pyroscope server — no manual steps needed.
Step 3: Run it
PYROSCOPE_SERVER_ADDRESS=http://pyroscope-server.observability.svc.cluster.local:4040 python app.py
Note: mem_enabled=True is what actually turns memory profiling on it’s easy to assume the SDK captures memory automatically just by being installed, but it doesn’t. Always cross-check against the Pyroscope Python SDK config reference for the version pinned in your requirements.txt, since default values have changed across SDK releases.
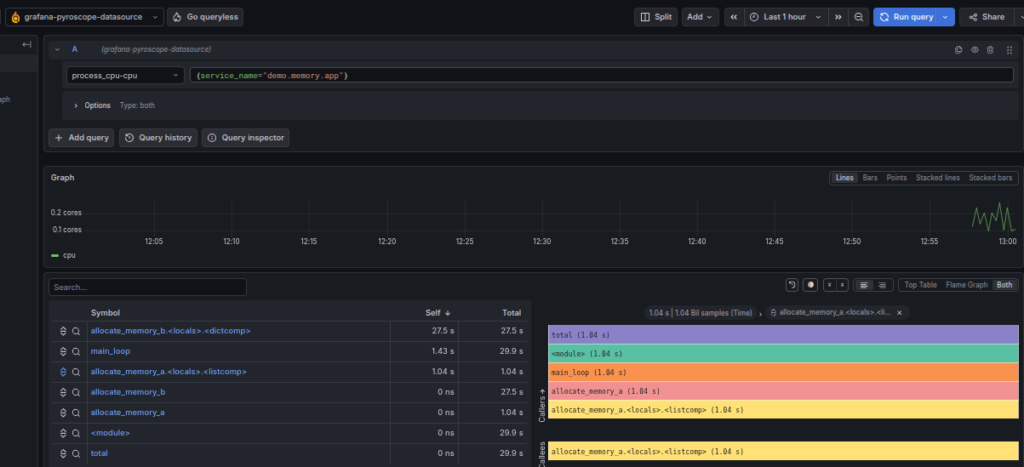
Step 4: Verify the Profiling Data in Grafana
5. Open Grafana and navigate to Explore
6. Select the **Pyroscope** data source.
7. Choose the required profile type, such as: **process_cpu\:cpu , memory\:alloc_space**
8. Filter the profiles using your application name **(for example, {service_name=”\<service-name>”}).**
9. Confirm that CPU and memory profiling data is available and that flame graphs are displayed for the selected application.
10. Verify the Profiling Data in Grafana like this :
Validation Checklist
| Validation Check | Verification Method |
|---|---|
| Pyroscope server is running | Run kubectl get pods -n observability and verify that the Pyroscope server pods are in the Running state. |
| Pyroscope service is reachable | Run kubectl get svc -n observability and confirm that the pyroscope-server service is available and exposed on port 4040. |
| Application is sending profiling data | In Grafana Explore, query the application using {service_name="<service-name>"} and verify that profiling samples are returned. |
| CPU profiling data is available | Select the process_cpu:cpu profile type in Grafana Explore and confirm that CPU flame graphs and function-level profiling data are displayed. |
| Memory profiling data is available (SDK-based profiling) | Select the memory:alloc_space profile type and verify that memory flame graphs and function-level profiling data are displayed. |
| Profiling data is valid | Verify that the CPU and memory flame graphs reflect the application’s expected behavior (for example, functions performing heavier operations consume more CPU time or allocate more memory). |
Best Practices
Follow these best practices to get accurate profiling data and maintain good application performance.
- Enable profiling only for the required applications and services.
- Review profiling data regularly to identify performance bottlenecks.
- Use Grafana dashboards to monitor and analyze profiling data.
- Monitor CPU and memory profiles periodically.
- Use continuous profiling for production workloads.
- Keep profiling configurations consistent across all environments.
Related Searches
- How Leading Telecom Enterprise Transformed Enterprise Analytics with Fractal GPT
- Real-Time Banking Data And AI-Powered Mule Detection with Confluent Platform
- Modernizing Healthcare Data Integration with Azure Event Hubs – OpsTree
- Implementing Supervisor Process Monitoring with Open Telemetry