
Last quarter, you had four major incidents. Two of them crossed the two-hour mark before resolution. Your engineers are talented. Your tools are not cheap. So why does incident response keep feeling this slow?
Here is what nobody is telling you directly: high MTTR is not a symptom of bad engineering. It is a symptom of bad visibility. When your logs live in one place, your infrastructure metrics in another, and your application performance data somewhere else entirely, your team is not responding to incidents. They are conducting a search operation first, and a rescue operation second. That delay has a name. It is called fragmented observability, and it is costing you more than you probably realize.
The Real Problem: Fragmented Observability
Here is something most leadership teams do not want to hear: the issue is rarely the engineers. The issue is the environment they are operating in.
Over the years, most organizations build up a collection of monitoring and observability tools, often without a plan. One team buys a log management tool. Another team sets up infrastructure monitoring. A third team starts using an APM solution for application performance. Nobody talks to each other. Nobody integrates anything. And now you have four, five, sometimes eight different tools running in parallel, each owned by a different team, each showing a different slice of what is happening in your systems.
This is what fragmented observability actually means. It is not a technology problem in the abstract. It is a visibility problem that shows up as chaos during every major incident.
When something breaks, your engineers cannot connect the dots quickly because the dots live in different places, with different access controls, different alert formats, and no shared language. That is precisely why your incident response feels slow and your MTTR keeps climbing. The answer to “why is my MTTR so high?” is almost always this: your teams cannot see the full picture from one place, so resolution time stretches from minutes into hours.
Fragmented observability is the single biggest structural reason organizations consistently fail to hit their incident response targets.
What High MTTR Is Actually Costing You
Long resolution times are not just an engineering inconvenience. They are a business liability.
Every hour of downtime or degraded performance chips away at customer trust. For SaaS companies, that trust translates directly to renewal rates and expansion revenue. For enterprises, it means SLA penalties, internal escalations, and in some cases, regulatory exposure. According to IBM’s Cost of a Data Breach Report, the average cost of a major IT incident continues to rise year over year, with detection and escalation delays being among the largest contributing factors.
Beyond the direct cost, there is the human cost. Engineers who spend their nights chasing alerts across disconnected tools eventually burn out. The best ones leave. And the institutional knowledge they take with them is not something you can recover quickly.
Your competitors who have already solved this problem are responding to incidents in minutes, not hours. That gap compounds over time.
Fragmented vs. Unified: What Changes for Your Business
| Business Dimension | Fragmented Observability | Unified Cloud Observability |
|---|---|---|
| Incident Response Time | Hours, requires manual correlation across tools | Minutes, with correlated alerts and one shared view |
| Tool Overhead | High, multiple vendors, licenses, and training costs | Reduced, consolidated platform with lower total cost |
| Cross-Team Visibility | Low, each team sees only their slice of the system | High, shared context across engineering, ops, and leadership |
| Customer Impact During Outages | Prolonged, slower resolution means longer customer-facing downtime | Minimized, faster detection and response reduces blast radius |
| Operational Cost | Inflated by redundant tooling and manual incident work | Optimized through automation and proactive alerting |
| Decision-Making Speed | Delayed, leadership lacks real-time operational context | Accelerated, dashboards and reports built for business decisions |
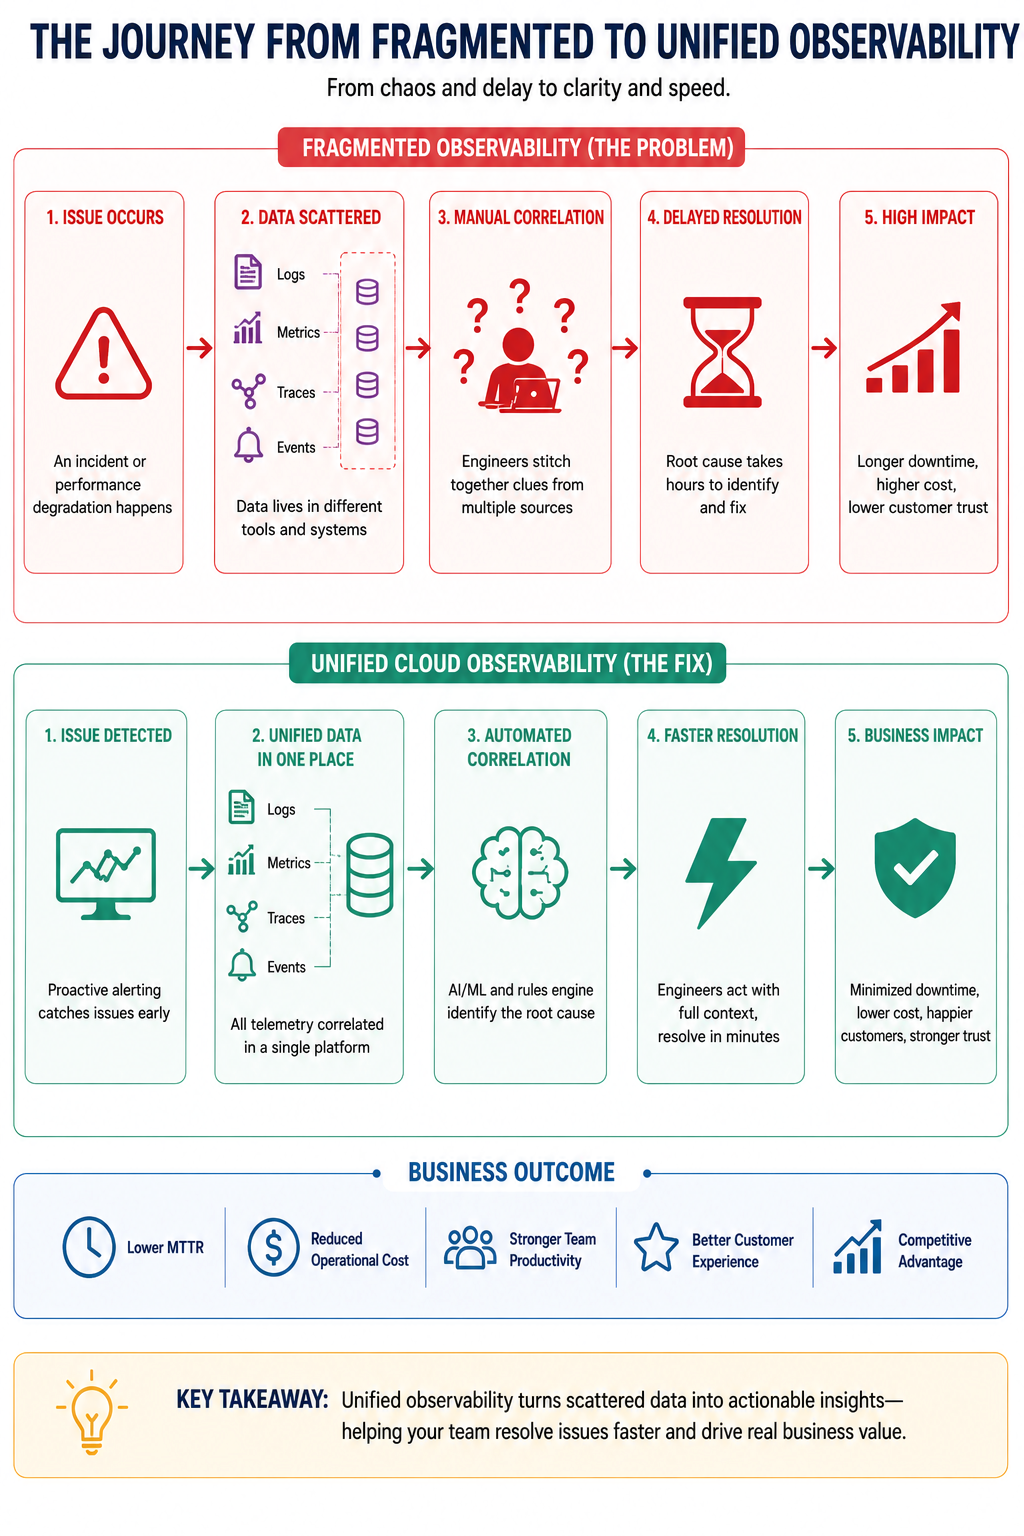
The Fix: Unified Cloud Observability
Unified cloud observability is not about buying one more tool. It is about creating a single operational picture that your entire organization can act on.
When done properly, your logs, metrics, traces, and events all flow into one place. Alerts are correlated automatically, so instead of five engineers getting five different alarms about five different symptoms, one team gets a single, contextualized alert that points toward the root cause. This alone cuts incident response time dramatically.
What this means for your business is straightforward. Your engineers stop wasting time switching between tools and start spending time on resolution. Your operations leaders stop relying on tribal knowledge from that one senior engineer who always figures it out. And your customers experience shorter outages, sometimes none at all, because problems are caught before they become visible.
Cloud observability, when it is built on solid SRE principles, also shifts your posture from reactive to proactive. Instead of finding out about a problem from a customer complaint, your systems surface the warning signs before anything breaks. That is the operational maturity that separates high-performing engineering organizations from everyone else.
Why Most Companies Get Stuck
Almost every VP or Director I have spoken with already knows their observability setup is a mess. They know. That is not the problem.
The problem is that fixing it feels like a massive undertaking, so it keeps getting pushed to the next quarter. There is also the vendor lock-in issue: your teams have built workflows and runbooks around existing tools, and nobody wants to own the migration project. And then there is the most common trap of all: the belief that adding one more tool will bridge the gap. It will not. You cannot solve fragmented observability by adding more fragments.
Organizational inertia is real. But so is the compounding cost of doing nothing while your MTTR stays high and your incidents keep running long.
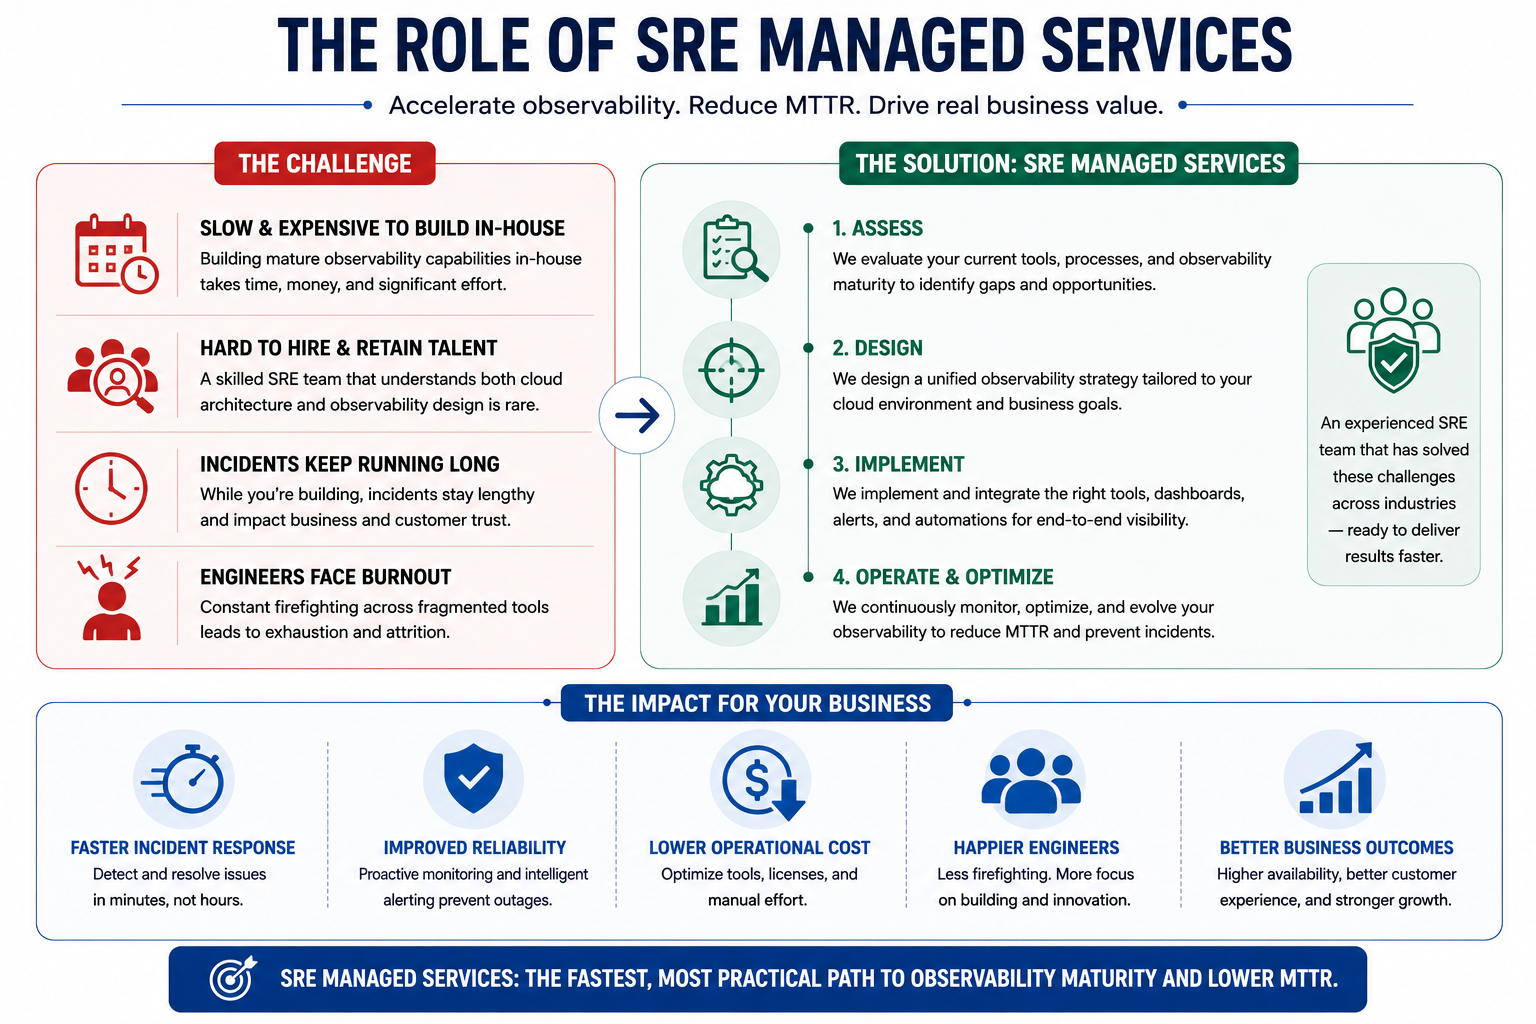
The Role of SRE Managed Services
Building a mature observability capability in-house is possible. It is also slow, expensive, and heavily dependent on talent that is genuinely hard to hire and retain.
A skilled SRE team that understands both cloud architecture and observability design does not come together in a few months. It takes years. In the meantime, your incidents keep running long and your engineers keep burning out.
SRE managed services offer a faster path. Instead of building the function from scratch, you bring in a team that has already done this across multiple environments and industries. They assess your current tooling, design a unified observability strategy, and implement it without the overhead of hiring, onboarding, and tool evaluation cycles.
For most organizations, this is the most practical route to getting incident response under control in a timeline that actually matters to the business.
How OpsTree Approaches Observability
OpsTree works with engineering and operations teams who are tired of long incident bridges and high MTTR numbers that they cannot seem to move. Our observability practice is built around one core idea: your teams should have unified visibility across your entire cloud environment, not just the part they personally own.
OpsTree helps organizations move from reactive firefighting to proactive operational intelligence. That means designing the right observability architecture, consolidating tooling where it makes sense, and building processes that let your teams act on data rather than hunt for it. The results are measurable, shorter incident response times, fewer SLA breaches, and engineering teams that are not exhausted by the end of every week.
If your incident response feels slower than it should, it is worth having a conversation about what unified observability could look like in your environment. Start that conversation with OpsTree.
Frequently Asked Questions
Q1. What does MTTR mean and why does it matter to business leaders?
MTTR measures how long ittakes your team to fix an issue after it is detected. For business leaders, it directly translates to downtime duration, customer impact, and SLA exposure. A high MTTR means longer outages, more revenue at risk, and lower customer confidence.
Q2. How does fragmented observability increase MTTR?
When monitoring data sits across multiple disconnected tools, engineers waste critical time switching between platforms just to understand what is happening. That context-switching during an active incident adds tens of minutes to resolution time, sometimes hours. Unified visibilityeliminates that delay.
Q3. Is unified cloud observability only relevant for large enterprises?
No. Mid-sized companies often feel the pain harder because they have fewer engineers to throw at a slow incident. If you are running workloads on cloud infrastructure and serving customers with uptime expectations, observability gaps will hurt you regardless of company size.
Q4. How long does it take to see results after fixing observability gaps?
Most organizations working with an experienced partner see measurable MTTR improvement within the first 60 to90 days. The biggest gains come early, once correlated alerting and a unified dashboard replace the manual, multi-tool investigation process.
Q5. What is the difference between monitoring and observability?
Monitoring tells you when something is wrong. Observability tells you why. Monitoringtracks predefined metrics and fires alerts. Observability gives your team the context to understand system behavior and trace the root cause, which is what actually drives faster resolution.