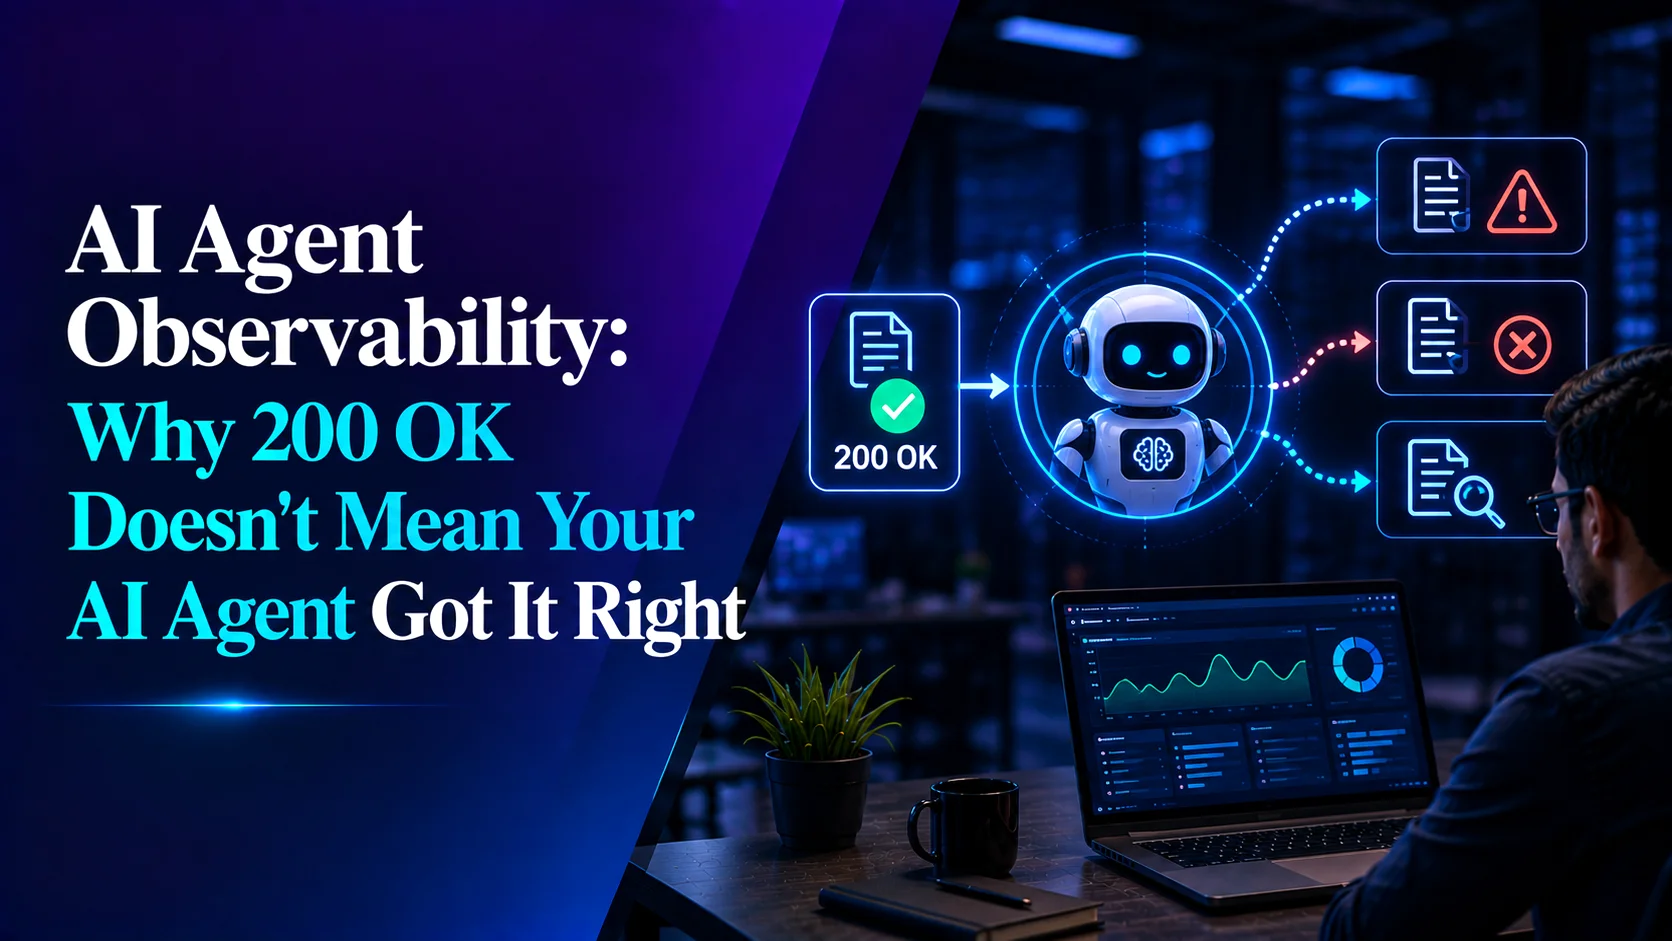

A practical guide to AI agent observability: how tracing, evaluation and structured debugging help teams monitor quality, investigate failures, manage cost, and operate agentic systems more reliably.
Quick answer: AI agent observability is the practice of capturing an agent’s execution path, model calls, retrieval context, tool inputs and outputs, evaluations, latency, token usage and cost so teams can determine whether the agent completed the user’s task correctly, not merely whether the API returned successfully. OpenTelemetry defines traces as the path of a request through an application, with spans representing individual units of work; agent observability applies that tracing idea to LLM calls, tools, retrieval and quality signals. OpenTelemetry traces document the path of a request and model the hierarchy through spans. Langfuse describes tracing as the starting point for ingesting and inspecting LLM and agent execution traces.
Research Basis, Validation Scope and Source Quality
This article should be treated as a research-backed technical guide, not a benchmark report. The conceptual foundation comes from OpenTelemetry’s trace-and-span model, official Langfuse documentation for tracing, masking, datasets, experiments, OpenTelemetry ingestion and self-hosting, plus operational practices from production observability. Any SDK syntax, region availability, licensing detail, hosting dependency or performance number must be checked against the exact Langfuse version and deployment model used at publication time. OpenTelemetry defines traces and spans as the core structure for understanding request execution paths.Langfuse documents OpenTelemetry ingestion through its OTLP endpoint and SDK guidance.Langfuse documents datasets as test collections for evaluating applications.
The Failure Your Dashboard Never Saw
Consider a support agent in production. Its latency and HTTP error-rate dashboards look healthy. Then a customer reports that the agent claimed a refund had been processed when it had not. The agent called search_orders, received an empty result, retried and eventually produced a confident but unsupported response. The exact numbers and sequence in this scenario are illustrative, the underlying failure pattern is a useful example of a successful request that still delivers an incorrect outcome.
Your APM recorded that as a successful HTTP request.
This is the gap. Traditional application performance monitoring (APM) helps answer whether a service responded and how it performed. Agent observability extends that view, did the agent complete the task correctly, use appropriate tools, rely on relevant evidence and stay within acceptable latency and cost limits? Both operational health and task quality matter.
Here’s the same request, seen through both lenses:
| What you’re monitoring | Traditional APM sees | Agent observability sees |
|---|---|---|
| The request | POST /chat → 200, 4.2s | Trace with 14 nested steps |
| The work | One service call | 6 LLM calls, 5 tool calls, 3 retrievals |
| The failure | Nothing – no exception thrown | search_orders returned [] on step 4 |
| The recovery | Invisible | Agent looped twice, then hallucinated |
| The cost | Not tracked | ₹18.40 for one conversation |
| The quality | Not a concept | Groundedness score: 0.2 |
Nothing crashed. That’s exactly the problem.
Why Agent Failures Are Structurally Different
In conventional services, many failures surface as explicit errors. Agent failures can also be semantic, a tool may return a valid response while the agent misinterprets it, skips a required step or produces an unsupported answer. The final response can sound plausible even when an earlier step was incorrect.
Three properties make this hard:
Non-determinism. The same input may lead to different outputs or execution paths, depending on model behavior, context, tool state, and system configuration. Capturing the original trace makes investigation more reliable, although replaying a request can still help reproduce some failures.
Depth, A single user turn fans out into planning, tool selection, retrieval, tool execution, reflection and synthesis. Modern agents add sub-agents and handoffs on top of that. The token overhead of loading tools alone can dominate a request before any reasoning happens.
Deferred symptoms, The bad tool argument on step 3 doesn’t surface until the summary on step 11. Without causal structure, you’re reading a wall of logs trying to work out which line poisoned the well.
The failure taxonomy that actually shows up in production:
| Failure mode | What it looks like | Where you catch it |
|---|---|---|
| Wrong tool selected | Agent calls send_channel_message instead of send_user_message | Tool call span, input args |
| Bad tool arguments | Correct tool, malformed or hallucinated parameters | Tool call span, input args |
| Silent tool failure | Tool returns empty/error, agent proceeds anyway | Tool output span + downstream generation |
| Infinite or near-infinite loop | Same step repeats 8 times before hitting a cap | Agent graph view, step counts |
| Retrieval miss | Right question, wrong documents retrieved | Retriever span, scored for relevance |
| Context overflow | Long session, early instructions fall out of context | Session view, token counts per turn |
| Groundedness failure | Output not supported by retrieved context | LLM-as-a-judge score on the trace |
| Cost blowout | One user, one session, 40 model calls | Trace cost aggregation |
Notice that only two of these throw an exception. The rest need you to look at content, not status codes.
Traditional APM vs LLM Observability vs Agent Observability
| Dimension | Traditional APM | LLM observability | Agent observability |
|---|---|---|---|
| Primary question | Did the service respond reliably? | What did the model receive and generate? | Did the agent complete the task correctly across planning, tools, retrieval, and synthesis? |
| Core data | Latency, errors, throughput, infrastructure metrics | Prompts, completions, tokens, model metadata, cost | Nested traces, tool calls, retrieval context, evaluations, user feedback, cost attribution |
| Failure visibility | Strong for exceptions and service degradation | Strong for model input/output inspection | Strong for semantic failures, wrong tool use, retrieval misses, loops, and unsupported answers |
| Best use | Operating distributed services | Improving LLM prompts and outputs | Operating production AI agents with multiple steps and dependencies |
The Three Layers That Make Agents Operable
The rest of this guide follows the same operating loop: first capture the agent’s execution path, then attach quality signals to that path, and finally use the combined evidence to debug, test, and govern future changes.
Agent observability is not one thing. It’s three layers that feed each other in a loop and skipping any one of them breaks the other two.
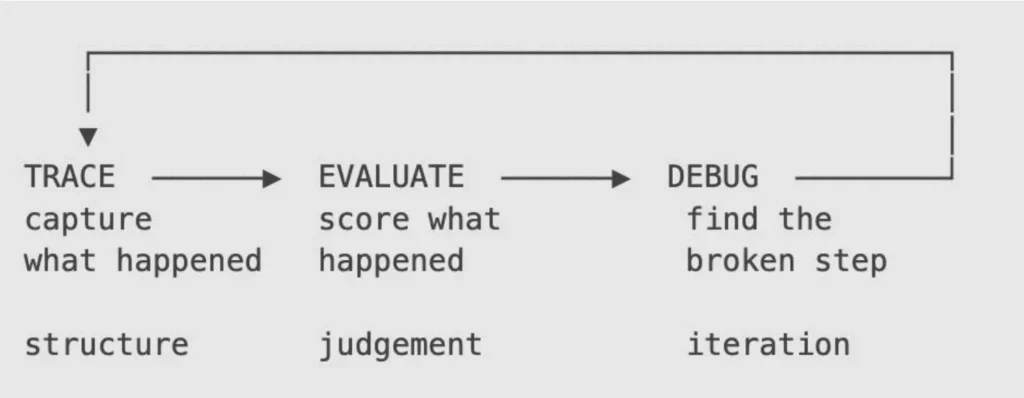
Tracing gives you the structure – a causal record of every step. Without it, you have nothing to evaluate and nothing to debug.
Evaluation gives you judgement – a score attached to that structure, so “is it good?” becomes a number you can chart, alert on and gate deploys with.
Debugging closes the loop – you find the broken step, turn that trace into a test case, fix it, and prove the fix with an experiment.
The examples use Langfuse as an illustrative observability platform. Product capabilities, SDK APIs, licensing, hosting options, and integrations can change, so verify them against the version you deploy. The underlying practices, trace structure, evaluation, and evidence-led debugging also apply to other observability platforms and OpenTelemetry-based architectures, though instrumentation details differ.
Layer 1: Tracing – Capture What Actually Happened
The data model you need to internalise
Everything else depends on getting this right.
| Concept | What it represents | Example |
|---|---|---|
| Trace | One end-to-end request | A user message and the agent’s full response |
| Observation | One step inside a trace | A single LLM call, tool call or retrieval |
| Span | A unit of work with duration | plan_next_action, execute_tool |
| Generation | A model call specifically | Captures prompt, completion, model, tokens, cost |
| Session | Traces grouped into a conversation | A 12-turn support chat |
| User | Traces attributed to a person | Everything user u_8812 did this week |
| Score | A quality judgement | groundedness: 0.91 on a trace or a single step |
Observations nest, That nesting is the whole point, it’s what lets you see that the bad summary was caused by the empty tool result, rather than just noticing both happened.
Why OpenTelemetry matters here
OpenTelemetry matters because it gives teams a common instrumentation path. Langfuse can receive OpenTelemetry traces through its OTLP endpoint, and its documentation recommends using the Langfuse SDK for Python or JavaScript/TypeScript when available because the SDK handles Langfuse-specific attributes, propagation, media, filtering, and export. This makes it possible to route agent telemetry through familiar observability infrastructure while still using an AI-focused platform for trace inspection, scoring and debugging.
Architecture flow: user request → agent runtime → LLM, tool, retrieval, and guardrail spans → OpenTelemetry SDK or Langfuse SDK → optional OpenTelemetry collector → Langfuse for AI-specific trace analysis and evaluation → existing APM for infrastructure correlation → dataset and CI regression workflow for future changes. Langfuse documents OTLP ingestion for OpenTelemetry traces.Langfuse datasets support test cases built from inputs and expected outputs.The Langfuse experiment GitHub Action can run experiments in CI and optionally fail a job when regressions are detected.
This is the difference between observability that your DevOps team adopts and observability that lives on one engineer’s laptop.
Instrumenting: three levels of effort
Level 1 — drop-in wrapper. Change one import, get traces:
# Before

from openai import OpenAI

# After

from langfuse.openai import openai

completion = openai.chat.completions.create(
    name="intent-classification",
    model="gpt-4o",
    messages=[{"role": "user", "content": user_input}],
    metadata={"tenant": "acme-corp"},
)
Level 2 – framework callback. For LangChain, LangGraph, CrewAI and similar, attach the handler and the framework’s internal structure becomes your trace structure:
from langfuse.langchain import CallbackHandler

langfuse_handler = CallbackHandler()

response = agent.invoke(
    {"messages": [{"role": "user", "content": "Where is my refund?"}]},
    config={"callbacks": [langfuse_handler]},
)
Level 3 – manual instrumentation. This is where you earn your money. Custom agent loops, business logic, non-LLM steps that still matter:
from langfuse import get_client

langfuse = get_client()

with langfuse.start_as_current_observation(
    as_type="span", name="refund-agent-run"
) as root:
    root.update(
        input={"query": user_query},
        metadata={"agent_version": "2.4.1", "tenant": tenant_id},
    )

    # Planning step
    with langfuse.start_as_current_observation(
        as_type="generation", name="plan", model="gpt-4o"
    ) as gen:
        plan = call_model(planning_prompt)
        gen.update(output=plan)

    # Tool execution — trace the tool, not just the model
    for step in plan.steps:
        with langfuse.start_as_current_observation(
            as_type="tool", name=f"tool:{step.tool_name}"
        ) as tool_span:
            tool_span.update(input=step.arguments)
            result = execute_tool(step)
            tool_span.update(
                output=result,
                metadata={"empty_result": len(result) == 0},
            )

    root.update(output=final_answer)


# Required in short-lived processes (scripts, serverless, CI)
langfuse.flush()
That empty_result flag is a thirty-second addition that turns an invisible failure into a filterable one. You can now search every trace where a tool came back empty and the agent answered anyway.
What a good trace looks like
Bad traces are worse than no traces, because they create the illusion of visibility. Five rules:
- Name spans semantically, not structurally. validate_refund_eligibility, not step_3. Six months from now you’ll be grateful.
- Capture inputs and outputs at every step, not just at the boundary. The whole value is in the intermediate state.
- Set session_id and user_id from day one. Retrofitting session grouping onto a live system is miserable.
- Put business context in metadata — tenant, environment, agent version, feature flag, prompt version. These become your filter dimensions when you’re triaging.
- Don’t trace everything. HTTP client spans and database queries from unrelated libraries will drown your agent trace in noise. Instrument deliberately.
The agent graph
When a trace contains typed observations beyond plain spans, some AI observability platforms can visualize the execution as an agent graph: nodes for steps and edges for control flow. Verify the exact graph capabilities, supported frameworks, and mode names against the platform version you deploy before making product-specific claims in the published blog.Langfuse states that agents can be represented as graphs and that traces can include LLM and non-LLM calls such as retrieval and API calls.
- Aggregated shows the agent’s overall shape. retrieve_docs (3/3) tells you a step ran three times; loops render as actual cycles. This is the view for “what does this agent generally do?”
- Expanded unrolls every call in execution order. This is the view for “where exactly did run #4471 go wrong?”
For anything with loops, sub-agents or handoffs, this is dramatically faster than scrolling a nested tree. It works with any framework or hand-rolled instrumentation, not just LangGraph.
Layer 2: Evaluation – Attach Judgement to Structure
Tracing tells you what happened. It does not tell you whether what happened was any good. That’s evaluation and it splits cleanly along one axis: are you scoring live traffic, or scoring a change before you ship it?
| Online evals | Offline evals | |
|---|---|---|
| Runs on | Live production traces | A fixed dataset |
| Answers | “How are we doing right now?” | “Is this change better?” |
| Cadence | Continuous, often sampled | Per PR, per experiment |
| Typical use | Quality trending, alerting, drift detection | Regression gates, prompt/model comparison |
| Cost profile | Scales with traffic — sample it | Scales with dataset size — bounded |
You need both. Online evals catch the drift you didn’t predict. Offline evals stop you shipping the regression you did.
Five ways to produce a score
| Method | Best for | Trade-off |
|---|---|---|
| Code evaluators | Deterministic checks – valid JSON, required fields, PII leakage, length caps | Cheap, fast, reliable; can’t judge nuance |
| LLM-as-a-judge | Groundedness, tone, helpfulness, task completion | Flexible; costs money, needs calibration |
| Human annotation | Ground truth, ambiguous cases, judge calibration | Highest quality; doesn’t scale |
| User feedback | Real-world signal – thumbs up/down, ratings | Free and honest; sparse and biased |
| Custom pipelines | Domain metrics your business actually cares about | Full control; you build and maintain it |
Start with code evaluators. Teams reach for LLM-as-a-judge first because it’s the interesting one, then discover that 40% of their failures were malformed JSON that a five-line assertion would have caught for free.
Project lesson: in real implementations, deterministic checks usually deliver the fastest first win. Valid JSON, required fields, empty tool output, policy violations, and schema failures are cheaper and more reliable to detect than subjective quality issues. Add LLM-as-a-judge only after the obvious checks are already automated and calibrated against human review.
Scoring in practice
from langfuse import get_client

langfuse = get_client()


# Attach a score to a trace you already know the ID of
langfuse.create_score(
    name="groundedness",
    value=0.91,
    trace_id=trace_id,
    data_type="NUMERIC",
    comment="All claims supported by retrieved context",
)


# Or score from inside the active context

with langfuse.start_as_current_observation(
    as_type="span", name="tool-call"
) as span:
    result = execute_tool(step)

    # Step-level score — this is the one people skip
    span.score(
        name="tool_returned_data",
        value=1 if result else 0,
        data_type="BOOLEAN",
    )

    # And a trace-level score for the run as a whole
    span.score_trace(
        name="task_completed",
        value=1,
        data_type="BOOLEAN",
    )
Score the steps, not just the answer. This is the single highest-leverage habit in agent evaluation. A trace-level score of 0.4 tells you the run was bad. Step-level scores tell you retrieval was fine, tool execution was fine, synthesis was bad , which is the difference between a week of guessing and an afternoon of fixing.
For user feedback, capture it as a score against the same trace ID and you get a direct join between “the user was unhappy” and “here is the exact reasoning chain that made them unhappy.”
Datasets and experiments: the regression gate
Every good production failure should become a permanent test case. The workflow:
- A trace fails in production.
- You add it to a dataset with the expected output.
- Every prompt change, model swap or code change runs against that dataset.
- Scores are compared to the previous run, side by side.
- If a score drops below threshold, the build fails.
That last step is what makes this engineering rather than vibes. Langfuse ships a GitHub Action for experiments on pull_request; your experiment script raises a regression error when a score violates its threshold and the job fails. Same idea as a failing unit test, applied to a non-deterministic system.
Build your dataset from three sources: real production failures (highest value), edge cases you can reason about in advance, and a boring happy-path set so you notice when a “safe” change breaks the basics.
Also Read: From Fragmented Data to Faster Decisions: Building a Unified Business Intelligence Platform
Layer 3: Debugging – Close the Loop
With traces and scores in place, debugging stops being archaeology and becomes a routine.
The loop:
- Start with a signal, not a hunch. A dropping score, an alert, a cluster of thumbs-down, a cost spike.
- Filter to the population. Traces where groundedness < 0.5 and tenant = acme-corp and agent_version = 2.4.1. You’re looking for a pattern, not an anecdote.
- Open the graph view. Find the shape of the failure — where does the path diverge from healthy runs? Loops and repeated steps announce themselves immediately.
- Drill into the first bad step. Not the bad output — the first step where the input was fine and the output wasn’t. That’s your actual bug.
- Reproduce in the playground. Take the exact prompt and context from that span, change one variable, see what happens.
- Turn it into a dataset item with the correct expected output.
- Fix, then run the experiment. Prove the fix works on that case and doesn’t break the other forty.
Common symptoms and where to look:
| Symptom | First place to look |
|---|---|
| Confident but wrong answers | Retriever span output, then groundedness score on the generation |
| Latency spike, no error | Step count per trace — the agent is probably looping |
| Cost spike | Token counts per generation; check whether tool definitions are bloating every call |
| Works in dev, fails in prod | Metadata diff — prompt version, model version, tool availability |
| Degrades over a long conversation | Session view, token count per turn, context window pressure |
| Intermittent tool failures | Tool spans filtered by empty/error output |
The move that pays for the entire setup: compare a failing trace against a passing trace for the same task. Two tabs, same structure, and the divergence point is usually obvious within a minute.
What to Consider Before You Roll This Out
Getting a trace into a dashboard is the easy part. Here’s what separates a demo from something your team relies on at 2am.
1. Decide what you’re allowed to capture
Agent traces contain prompts and completions, which means they contain whatever your users typed. That’s PII, and possibly regulated data. Before you instrument anything:
- Use SDK-level masking to redact sensitive fields before they leave your process.
- Choose a data region deliberately if using Langfuse Cloud. Current documentation lists US, EU, Japan, and HIPAA regions, with accounts and data separated between regions; verify availability and compliance terms before go-live.Langfuse documentation lists Cloud regions and explains that data and accounts are separated between regions.
- Set retention policies that match your compliance posture, not the default.
- Get this signed off before go-live, not during the audit.
This is the same discipline that applies to building a secure enterprise MCP server — the observability layer sees everything the agent sees, so it inherits the agent’s entire threat model.
2. Sample, and sample intelligently
Tracing every request at full fidelity is affordable at 1,000 requests/day and painful at 10 million. But naive random sampling is the wrong answer, because failures are rare and random sampling throws most of them away.
A pattern that works:
| Traffic class | Sampling rate |
|---|---|
| Errors and exceptions | 100% |
| Traces with a failing score | 100% |
| Traces above a cost or latency threshold | 100% |
| New agent version, first 24h | 100% |
| Everything else | 1–10% |
LLM-as-a-judge evaluation can add meaningful cost and latency, depending on model, sampling rate and trace volume. Measure the cost of evaluation and trace storage in your own workload; retain enough evidence to investigate failures.
3. Never block the request path
Observability should not add meaningful latency to the user-facing request path. Use asynchronous batching where available, measure overhead in your own workload, and verify that telemetry failures do not block responses. For short-lived processes such as serverless functions, CLI tools, and CI jobs, explicitly flush before exit so traces are not lost.Langfuse data-region documentation notes that tracing ingestion is sent asynchronously in batches, making ingestion latency less directly relevant to application performance.
- In short-lived processes – serverless functions, CLI tools, CI jobs, call flush() before exit or you’ll silently lose traces.
- If the observability backend is down, your agent must keep serving. Verify this explicitly; don’t assume it.
4. Treat span naming as a public API
Your span names become your filter dimensions, your dashboard groupings and your alert conditions. Rename them casually and you break six months of historical comparison.
- ✅ retrieval.search_knowledge_base
- ✅ tool.jira_create_issue
- ✅ llm.synthesize_answer
- ❌ step_2
- ❌ call_model (which model? for what?)
Namespace them. Version them if you must change them. Same rules as tool naming in MCP , it’s a contract, not a label.
5. Link prompt versions to traces
If you’re managing prompts centrally and you should be record which prompt version produced each generation. Without it, “quality dropped on Tuesday” is unanswerable. With it, it’s a two-click diff between version 7 and version 8.
6. Evaluate your evaluator
LLM-as-a-judge is a model call, which means it has all the same failure modes as the thing it’s judging. Judges drift, judges are biased toward verbose answers, judges score their own model family higher.
Calibrate: have a human annotate 50–100 traces, compare against your judge’s scores, and measure the agreement. If agreement is poor, fix the judge prompt before you trust a single dashboard built on it. Re-check after any judge model upgrade.
7. Plan the self-hosting reality
Langfuse is MIT-licensed and self-hostable on every tier, which is often the deciding factor for enterprise and regulated workloads. Two things to know going in:
- Self-hosting requires planning for ClickHouse as the main OLAP storage layer for traces, observations, and scores, alongside the other platform dependencies. Langfuse documentation describes ClickHouse as the primary analytical store for these entities and lists supported deployment options and version requirements.Langfuse documents ClickHouse as the main OLAP storage solution for trace, observation, and score entities.
- Review the platform’s current ownership, roadmap, hosting model, and storage dependencies during procurement. These details can change and should be verified against current vendor documentation.
Benchmark the version you intend to deploy using representative trace volume, retention, query patterns, and concurrency rather than relying on older performance reports.
Enterprise implementation checklist: validate storage dependencies, backup and restore, retention cost, masking strategy, access controls, tenant isolation, audit requirements, data residency, upgrade process, and the team that owns the platform after launch. Treat agent traces as sensitive operational data because they may contain prompts, completions, retrieved documents, tool arguments, and user-provided information.Langfuse self-hosting documentation describes client-side and server-side masking approaches for sensitive data.Langfuse masking documentation explains how masking functions can redact sensitive tracing data before export.
8. Make it part of the platform, not a side project
The failure mode for observability projects is that one enthusiastic engineer instruments one service, and nobody else adopts it. Avoid it by:
- Putting instrumentation in your shared agent scaffolding, so new agents are traced by default.
- Standardising metadata keys across teams (tenant, env, agent_version) so dashboards work across services.
- Wiring the CI regression gate on day one , that’s what makes evals load-bearing rather than decorative.
- Routing agent spans through your existing OTel collector so this lives alongside your other telemetry instead of beside it.
Decision Guide: How Much Observability Do You Actually Need?
| Where you are | Tracing | Online evals | Datasets + CI gate |
|---|---|---|---|
| Prototype, single developer | Basic — SDK wrapper | Skip | Skip |
| Internal tool, low stakes | Full manual instrumentation | Sampled, 1–2 metrics | Small dataset, manual runs |
| Customer-facing, single agent | Full + sessions + users | Sampled + user feedback | Required |
| Multi-agent / high stakes | Full + graph view + step scores | Comprehensive | Required + blocking CI |
| Regulated (finance, health) | Full + masking + self-host | Comprehensive + audit trail | Required + human annotation |
Start Here: The First Week
If you’re instrumenting an existing agent, this order gets you value fastest:
| Day | Do this |
|---|---|
| 1 | Add the SDK wrapper or framework callback. Get any trace flowing. |
| 2 | Add session_id, user_id and metadata (env, version, tenant). |
| 3 | Manually instrument tool calls — inputs, outputs, and an empty-result flag. |
| 4 | Add two code evaluators: output validity, and a “tool returned data” check. |
| 5 | Pull 20 real traces into a dataset. Include your worst known failures. |
| 6 | Wire up one LLM-as-a-judge metric. Calibrate it against 30 human-labelled traces. |
| 7 | Put the experiment run in CI with a score threshold. |
A focused first week can establish the foundations for better visibility. Detection time will depend on instrumentation coverage, evaluation cadence, alerting, and operational ownership.
Original Value: Practical Lessons That Make This More Than a Tool Overview
The most useful agent observability programs do not start with dashboards; they start with failure review. Pick five recent bad answers, trace each one to the first incorrect step, and ask what signal would have caught it earlier. That exercise usually produces a better instrumentation plan than copying a generic observability checklist.
Common mistakes include tracing only the final response, hiding tool inputs for convenience, failing to version prompts, sampling away rare failures, using LLM-as-a-judge without calibration, and treating cost as a monthly bill instead of a trace-level debugging signal. The highest-value improvement is usually not a new model; it is better evidence about where the current agent failed.
One Last Thing
The instinct when an agent misbehaves is to reach for the prompt. Add a line. Tell it to be more careful. Ship it and hope.
That instinct is the problem. It treats a system with a dozen moving parts as a single text box, and it produces the specific kind of codebase where nobody can explain why the prompt says what it says, and nobody dares change it.
Observability replaces that with something ordinary and unglamorous: look at what happened, measure whether it was good, find the step that broke, fix that step, prove it with a test. It’s the same discipline we already apply to distributed systems. Agents don’t get an exemption just because the failure mode is a paragraph of fluent English instead of a stack trace.
Teams operating reliable agents need more than carefully written prompts: they need evidence of what happened, a way to measure quality, and a repeatable process for locating and validating fixes.
Related Searches
- How Leading Telecom Enterprise Transformed Enterprise Analytics with Fractal GPT
- Real-Time Banking Data And AI-Powered Mule Detection with Confluent Platform
- Modernizing Healthcare Data Integration with Azure Event Hubs – OpsTree