
Executive Summary
Organizations today generate more business data than ever before. Every customer interaction, supplier transaction, inventory update, financial record, and operational event contributes to an ever-expanding ecosystem of information. Despite this abundance of data, many organizations continue to struggle with one fundamental challenge: turning information into timely business decisions.
As businesses scale, data naturally becomes distributed across multiple applications, operational systems, cloud platforms, and third-party services. Finance teams maintain their own reports, operations rely on separate dashboards, inventory teams work with independent systems, and executives often receive different answers to the same business question.
The result is an organization rich in data but poor in visibility.
When leadership teams spend more time validating reports than making decisions, the problem is no longer about reporting, it is about architecture.
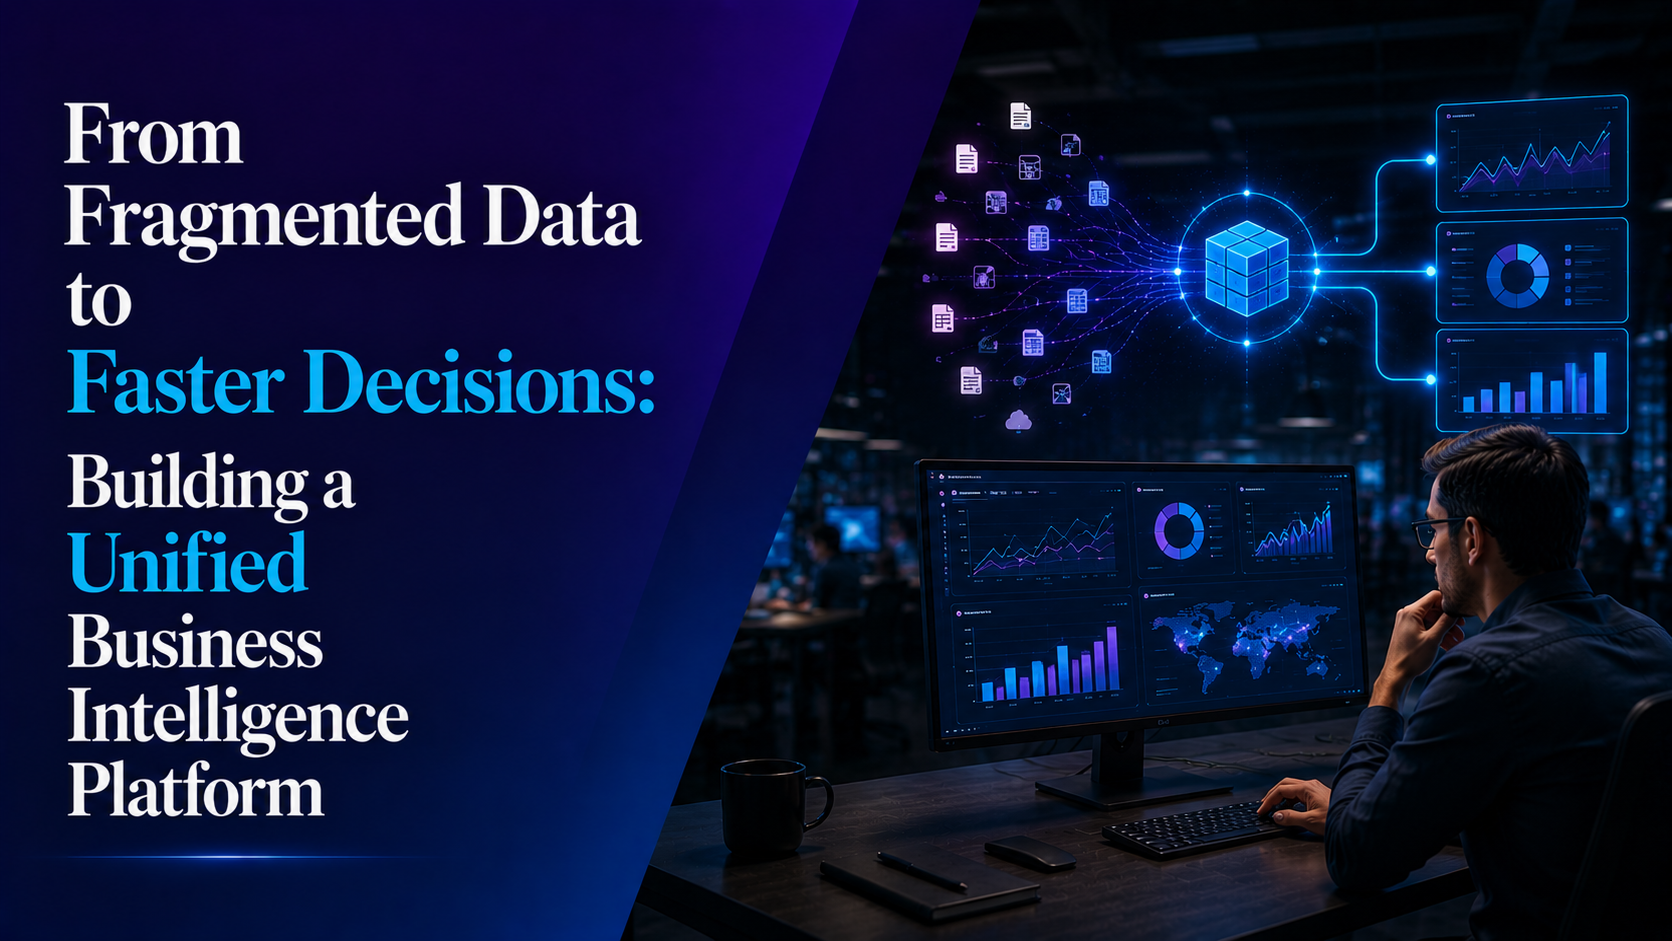
A modern Business Intelligence (BI) platform addresses this challenge by creating a unified view of enterprise data, enabling organizations to move beyond historical reporting toward real-time operational intelligence and predictive decision-making.
In this article, we share practical insights gained from enterprise data modernization initiatives, explain why fragmented reporting limits business growth, and explore how organizations can build a unified Business Intelligence platform that supports faster, smarter, and more confident decision-making.
Also Read: Transforming Fragmented Business Data into Actionable Insights Through a Modern Data Platform
Why Decision-Making Becomes Slower as Organizations Grow
Growth is a sign of business success.
However, growth also introduces complexity.
A company that once operated with a single operational database may gradually adopt dozens of specialized applications to support different business functions. Sales teams invest in CRM platforms. Finance implements ERP systems. Customer service adopts ticketing tools. Marketing uses campaign management platforms, while operations introduce inventory management, supplier portals, logistics systems, and analytics applications.
Each system performs its intended function exceptionally well.
The challenge begins when leadership needs a consolidated view of the business.
Questions that should take seconds to answer suddenly require hours or even days.
For example:
- Which suppliers are consistently delaying fulfilment?
- Which products generate the highest profitability after accounting for operational costs?
- Which regions are experiencing unusual redemption activity?
- How much working capital is currently tied up with supplier balances?
- Which inventory categories are likely to experience shortages within the next few weeks?
- Are operational costs increasing faster than revenue growth?
The information required to answer these questions already exists.
Unfortunately, it exists across multiple disconnected systems.
Without an integrated analytics platform, organizations often depend on manual consolidation efforts that consume valuable time while increasing the likelihood of inconsistent reporting.
What We’ve Learned from Enterprise Business Intelligence Projects
One of the most common misconceptions about Business Intelligence is that purchasing a dashboarding tool automatically makes an organization data-driven.
Our experience across enterprise data modernization initiatives suggests otherwise.
Organizations rarely struggle because they lack visualization software.
They struggle because they lack a trusted, centralized foundation for their data.
Across projects spanning retail, digital commerce, financial services, manufacturing, and enterprise operations, we’ve consistently observed the same pattern.
The business has invested heavily in operational systems, yet executive reporting remains largely manual.
Departments independently generate reports using their own data sources and business logic. As a result, identical KPIs often produce different values depending on who prepared the report.
When this happens, meetings shift away from discussing business strategy and become exercises in validating numbers.
Instead of asking:
“What actions should we take?”
Leadership teams begin asking:
“Which report is actually correct?”
This subtle shift has significant business consequences.
Organizations become slower, less agile, and increasingly reactive—not because they lack capable people, but because decision-makers cannot confidently trust the information presented to them.
In our experience, successful Business Intelligence initiatives begin by solving the problem of fragmented data rather than simply improving visualization.
The Hidden Cost of Fragmented Business Intelligence
Most organizations recognize the visible costs associated with inefficient reporting.
Analysts spend hours preparing spreadsheets.
Managers wait for weekly reports.
Executives request repeated data reconciliations.
However, the greatest costs are often invisible.
Delayed Decision-Making
Every business decision depends on timely information.
When reports require manual preparation, leadership frequently makes decisions using outdated data.
Opportunities that existed yesterday may no longer exist by the time reports are delivered.
Similarly, operational issues that could have been resolved proactively often escalate before becoming visible.
Conflicting Business Metrics
One of the clearest indicators of fragmented Business Intelligence is the presence of multiple versions of the same KPI.
Finance reports one revenue figure.
Operations reports another.
Sales presents a third.
Although each report may be technically correct according to its own data source, inconsistent definitions erode confidence across the organization.
Without standardized business metrics, executives spend valuable time reconciling numbers instead of acting upon them.
Operational Blind Spots
Organizations often possess extensive historical data but limited real-time visibility.
By the time anomalies become apparent through scheduled reports, the business impact has already occurred.
Examples include:
- Supplier fulfilment delays
- Declining inventory levels
- Unexpected transaction spikes
- Fraudulent behaviour
- Customer redemption anomalies
- Operational bottlenecks
Earlier visibility enables earlier intervention.
Earlier intervention reduces business risk.
Increasing Operational Costs
Fragmented reporting also creates hidden operational costs.
Analysts repeatedly perform identical extraction, cleansing, and reconciliation activities across departments.
Separate teams build duplicate dashboards.
Cloud resources are consumed processing similar datasets multiple times.
Over time, reporting complexity grows significantly faster than business value.
Reduced Confidence in Data
Perhaps the greatest consequence is the gradual erosion of trust.
Once executives begin questioning the reliability of business reports, they increasingly rely on intuition and experience rather than data.
At this stage, analytics no longer supports decision-making, it merely documents what has already happened.
Also Read: Large-Scale MySQL Database Migration on AWS RDS: A Practical Guide to Achieving Near-Zero Downtime
Why Traditional Reporting No Longer Meets Modern Business Needs
Historically, organizations relied on periodic reporting cycles.
Daily reports.
Weekly summaries.
Monthly business reviews.
Quarterly executive dashboards.
These reporting models were effective when business environments changed relatively slowly.
Today’s organizations operate differently.
Customer expectations evolve continuously.
Supply chains fluctuate daily.
Inventory levels change by the hour.
Fraud patterns emerge in minutes rather than weeks.
Business leaders require information that reflects the current state of operations, not yesterday’s performance.
Traditional reporting architectures struggle to support these expectations because they were designed primarily for historical analysis rather than operational intelligence.
As businesses become increasingly digital, reporting must evolve beyond static dashboards.
Modern Business Intelligence platforms enable organizations to move from answering:
“What happened?”
to asking:
“What is happening right now?”
and ultimately,
“What is likely to happen next, and what should we do about it?”
This shift represents the difference between reporting and intelligence.
The Foundation of Modern Business Intelligence
A modern Business Intelligence platform is not defined by the dashboarding tool used to visualize data.
Its success depends on the quality, consistency, and accessibility of the underlying data platform.
Organizations that consistently make faster decisions typically share several characteristics:
- A centralized repository that consolidates data from multiple operational systems.
- Standardized business definitions that ensure consistent KPIs across departments.
- Automated data integration pipelines that reduce manual effort.
- Near real-time data processing that keeps information current.
- Governance mechanisms that maintain data quality and trust.
- Analytics capabilities that move beyond historical reporting toward predictive insights.
By establishing this foundation, organizations create an environment where business users spend less time searching for information and more time using it to make informed decisions.
The result is not simply better reporting, it is a business capable of responding to change with greater speed, confidence, and precision.
Designing a Unified Business Intelligence Platform
One of the biggest misconceptions surrounding Business Intelligence is that dashboards are the platform.
In reality, dashboards represent only the final layer of a much larger architecture.
Behind every meaningful executive dashboard lies a carefully engineered ecosystem responsible for collecting, validating, transforming, and organizing enterprise data.
A modern Business Intelligence platform typically consists of five interconnected layers:
- Data Integration
- Centralized Data Platform
- Data Transformation & Governance
- Business Intelligence & Analytics
- Predictive Intelligence
Each layer contributes to improving business visibility and reducing decision-making time.
Creating a Single Source of Truth
One of the primary objectives of any Business Intelligence initiative is establishing a Single Source of Truth (SSOT).
Without it, different departments inevitably develop their own reporting logic.
Sales may define “Active Customers” differently than Finance.
Operations may calculate inventory differently from Procurement.
Marketing may report campaign performance using different attribution models.
Although every report may be technically correct, inconsistent definitions create confusion across the organization.
A Single Source of Truth eliminates these discrepancies by consolidating enterprise data into one trusted environment.
Instead of every department maintaining separate spreadsheets and independent calculations, all business users access standardized datasets built upon common business definitions.
This approach offers several advantages:
- Consistent KPIs across departments
- Reduced duplication of reporting effort
- Improved confidence in executive dashboards
- Faster access to trusted information
- Simplified compliance and audit reporting
Perhaps more importantly, leadership teams spend less time reconciling numbers and more time discussing business strategy.
Bringing Data Together Across the Enterprise
Building a Single Source of Truth requires more than simply copying data into one database.
Enterprise information typically resides across multiple operational systems, each designed for specific business functions.
These may include:
- ERP systems
- CRM platforms
- Supplier Management Systems
- Inventory Management Systems
- E-commerce platforms
- Financial Applications
- Customer Support Systems
- Payment Gateways
- Marketing Platforms
- Third-party APIs
Each system generates valuable information, but none provides a complete picture of business performance independently.
Modern data integration pipelines continuously collect information from these systems, standardize formats, apply business rules, and consolidate the data into a centralized analytics platform.
Automation ensures that information remains current while eliminating the manual effort previously required to prepare reports.
Delivering Real-Time Operational Visibility
Historically, business reporting focused on understanding what had already happened.
Modern organizations require visibility into what is happening right now.
Real-time operational visibility transforms the way organizations manage daily operations.
Instead of waiting for end-of-day or weekly reports, leadership teams gain immediate insight into business performance as events occur.
Executive dashboards typically provide visibility into:
Supplier Performance
Organizations can monitor supplier responsiveness, fulfilment efficiency, service quality, and operational trends.
Rather than discovering supplier issues after customer complaints arise, procurement teams can proactively identify declining performance before it affects business operations.
Product Availability
Inventory movement becomes visible across locations, warehouses, and distribution channels.
Business users can quickly identify:
- Fast-moving products
- Slow-moving inventory
- Potential stock shortages
- Overstock situations
- Seasonal demand patterns
This enables proactive inventory planning rather than reactive replenishment.
Transaction Monitoring
Near real-time transaction monitoring allows organizations to observe operational activity as it occurs.
Executives gain immediate visibility into:
- Transaction volumes
- Redemption activity
- Payment trends
- Revenue patterns
- Regional business performance
This improves both operational awareness and financial oversight.
Operational KPIs
Rather than reviewing isolated reports from different departments, leadership teams access unified dashboards containing the organization’s most important performance indicators.
Examples include:
- Revenue Growth
- Order Fulfilment
- Inventory Health
- Supplier Performance
- Customer Activity
- Operational Efficiency
- Working Capital Utilization
Because all metrics originate from standardized datasets, every department works with the same business definitions.
Moving Beyond Reporting with Predictive Intelligence
One of the most significant shifts in modern Business Intelligence is the transition from descriptive analytics to predictive analytics.
Traditional dashboards answer questions such as:
- What happened yesterday?
- How many transactions occurred last week?
- What was last month’s revenue?
These insights remain valuable.
However, they provide limited opportunity to influence future outcomes.
Predictive intelligence enables organizations to ask a different set of questions:
- Which suppliers are likely to experience delays next month?
- Which products may run out of inventory?
- Which customer segments are expected to grow?
- Where are operational risks beginning to emerge?
- Which financial trends require immediate attention?
Rather than reacting to historical events, organizations begin anticipating future business conditions.
Applying Predictive Intelligence Across Business Functions
Predictive capabilities can be integrated into multiple operational areas.
Supplier Performance Forecasting
Historical fulfilment trends, lead times, and supplier behaviour can be analysed to identify vendors likely to experience future performance issues.
This enables procurement teams to intervene before disruptions impact customers.
Inventory Planning
Historical demand patterns combined with seasonal trends support more accurate inventory forecasting.
Organizations can optimize stock levels while reducing both shortages and excess inventory.
Demand Forecasting
Forecasting models help predict future purchasing behaviour, allowing businesses to prepare inventory, staffing, and operational capacity accordingly.
Better forecasts improve customer satisfaction while reducing unnecessary operational costs.
Fraud Detection
Historical transaction behaviour can be analysed continuously to identify unusual patterns that may indicate fraudulent activity.
Rather than relying solely on manual investigation, organizations gain earlier visibility into emerging risks.
Working Capital Optimization
Predictive analytics also supports financial planning by identifying opportunities to improve supplier balances, optimize cash flow, and better manage working capital requirements.
Automating Reporting and Improving Operational Efficiency
One of the least visible benefits of a modern Business Intelligence platform is the elimination of repetitive reporting activities.
Before modernization, analysts often spent considerable time:
- Extracting data
- Cleaning spreadsheets
- Combining reports
- Validating calculations
- Preparing executive presentations
These activities consumed valuable resources while delaying business decisions.
Automation fundamentally changes this process.
Instead of producing reports manually, data pipelines continuously prepare curated datasets for business consumption.
Dashboards refresh automatically as new information becomes available.
Business users access trusted insights directly rather than requesting custom reports from analytics teams.
This shift enables analysts to focus on higher-value activities such as:
- Business analysis
- Trend identification
- Strategic planning
- Process improvement
- Predictive modelling
The result is a more efficient analytics function that supports business growth rather than merely reporting historical performance.
Reference Architecture
Business Applications
Data Integration Layer
Centralized Data Platform
Data Transformation & Governance
Business Intelligence Layer
Predictive Intelligence Layer
This architecture separates operational systems from analytical workloads, improving both performance and scalability while ensuring that reporting remains consistent across the organization.
Why This Architecture Works
Successful Business Intelligence platforms are not built around dashboards—they are built around trusted data.
This architecture succeeds because it emphasizes three fundamental principles.
Consistency
Every department consumes the same curated datasets and standardized business definitions.
Scalability
As transaction volumes increase, the platform can accommodate additional data sources, users, and analytical workloads without requiring major architectural changes.
Intelligence
By combining historical reporting with predictive analytics, organizations gain the ability not only to understand past performance but also to anticipate future business outcomes.
Ultimately, technology becomes an enabler rather than the objective.
The true value of a Unified Business Intelligence Platform lies in its ability to transform fragmented enterprise data into timely, reliable, and actionable business intelligence that supports faster, smarter decision-making.
Measuring Success Beyond Dashboards
One of the most common mistakes organizations make is measuring the success of a Business Intelligence initiative by the number of dashboards created.
While dashboards are important, they are not the objective.
The objective is better business decisions.
A successful Business Intelligence platform should improve:
- Decision-making speed
- Operational visibility
- Data consistency
- Cross-functional collaboration
- Business agility
- Executive confidence
These outcomes directly influence an organization’s ability to respond quickly to changing business conditions.
Business Transformation in Practice
One organization we worked with was experiencing rapid business growth across supplier operations, product management, inventory planning, customer transactions, and financial reporting.
Although each department maintained detailed operational data, information was spread across multiple business systems.
Leadership teams faced several recurring challenges.
Operational reports were generated independently by different departments.
Business reviews frequently began with discussions about which report was correct rather than what actions should be taken.
Analysts spent significant time preparing spreadsheets instead of analysing business trends.
Operational risks such as supplier delays, inventory shortages, and unusual transaction patterns often became visible only after they had already affected customers.
The organization recognized that reporting was no longer the problem.
The underlying challenge was fragmented business intelligence.
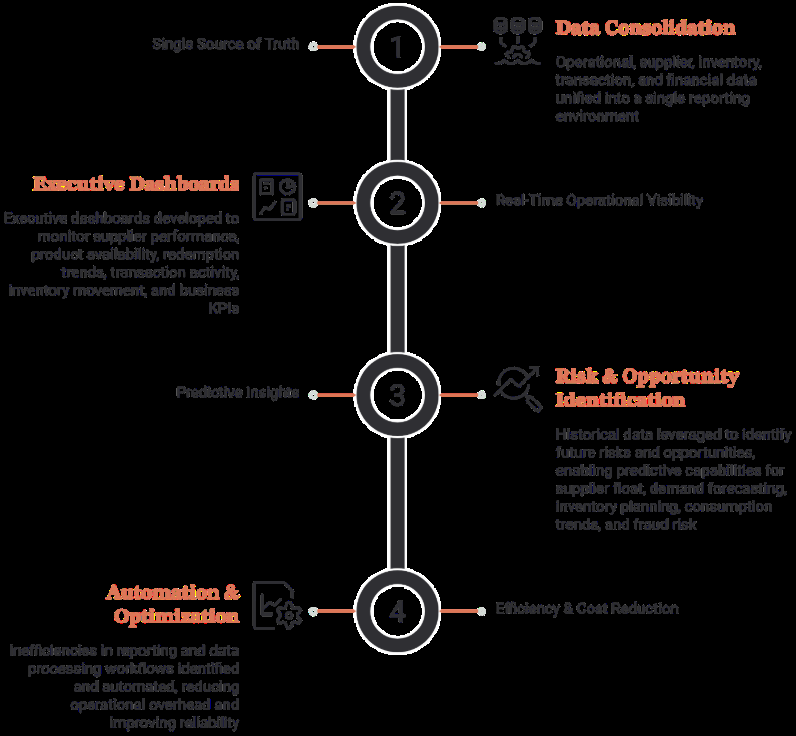
To address this, a centralized Business Intelligence platform was implemented that unified operational and financial data into a single reporting environment.
Rather than replacing existing business systems, the initiative focused on integrating them into a common analytics platform.
Automated data pipelines continuously collected information from operational systems, standardized business definitions, and produced curated datasets for enterprise reporting.
Executive dashboards provided leadership with near real-time visibility into supplier performance, product availability, transaction activity, inventory movement, financial trends, and operational KPIs.
Historical business data was also leveraged to introduce predictive capabilities for demand forecasting, supplier float management, inventory planning, and fraud risk monitoring.
As a result, the organization transformed from relying on static reports into a business capable of making proactive, insight-driven decisions.
Business Outcomes
The implementation delivered measurable operational improvements across multiple business functions.
Faster Decision-Making
Leadership teams no longer waited for manually prepared reports before making operational decisions.
Near real-time dashboards provided immediate access to trusted business information, significantly reducing the time required to identify issues and respond to changing business conditions.
Decision-making cycles were reduced by approximately 80%, allowing executives to focus on business strategy rather than report validation.
Improved Revenue Protection
Continuous monitoring of operational activity enabled earlier identification of unusual transaction patterns and operational anomalies.
Rather than discovering issues during periodic reviews, business teams could investigate potential risks as they emerged, reducing exposure to financial losses.
Better Inventory Management
Predictive insights improved visibility into inventory movement and future demand.
Operations teams gained sufficient lead time to address potential shortages before they affected customers, improving product availability while reducing excess inventory.
Stronger Supplier Performance Management
Business leaders gained comprehensive visibility into supplier fulfilment behaviour, operational trends, service levels, and working capital utilization.
This enabled more informed supplier discussions and improved long-term operational planning.
Reduced Reporting Dependency
Automation significantly reduced the manual effort previously required to prepare business reports.
Analysts shifted their focus from collecting data to interpreting trends, identifying opportunities, and supporting strategic decision-making.
Greater Executive Confidence
Perhaps the most significant outcome was the establishment of a single, trusted source of business information.
Leadership teams gained confidence that every department was working with consistent metrics, allowing discussions to focus on business outcomes rather than reconciling conflicting reports.
Common Mistakes Organizations Make
Throughout our experience with enterprise Business Intelligence initiatives, several recurring challenges consistently emerge.
Recognizing these early can significantly improve the success of modernization programs.
Mistake 1: Treating Dashboards as the Solution
Dashboards visualize information.
They do not solve fragmented data.
Without standardized business definitions and centralized data management, dashboards simply display inconsistent information more efficiently.
Mistake 2: Building Department-Specific Reports
When every department creates its own reports independently, duplicate logic and conflicting KPIs become inevitable.
Business Intelligence should unify reporting rather than reinforce organizational silos.
Mistake 3: Ignoring Data Governance
Organizations often focus heavily on technology while overlooking governance.
Without agreed business definitions, data quality standards, and ownership responsibilities, confidence in analytics gradually declines.
Mistake 4: Prioritizing Historical Reporting
Traditional reports explain what has already happened.
Modern organizations also require visibility into current operations and future business trends.
Predictive analytics should complement historical reporting rather than replace it.
Mistake 5: Underestimating Change Management
Technology implementation is only part of the journey.
Successful Business Intelligence initiatives require stakeholder engagement, user adoption, training, and executive sponsorship.
Organizations that invest in people achieve significantly greater long-term value from their analytics platforms.
Best Practices for Building a Modern Business Intelligence Platform
Organizations beginning their Business Intelligence modernization journey should consider the following principles:
- Establish a centralized Single Source of Truth before expanding dashboard development.
- Standardize business definitions across departments to eliminate conflicting KPIs.
- Automate data integration wherever possible to reduce manual reporting effort.
- Prioritize data quality and governance alongside technology implementation.
- Build executive dashboards around business decisions rather than technical metrics.
- Introduce predictive analytics to support proactive decision-making.
- Design platforms that scale with future business growth.
- Continuously monitor platform performance and data freshness.
- Encourage cross-functional collaboration throughout the implementation process.
- Treat Business Intelligence as an ongoing business capability rather than a one-time technology project.
Lessons Learned
Every Business Intelligence transformation reinforces several important lessons.
Data Alone Does Not Create Business Value
Organizations already possess enormous amounts of data.
Competitive advantage comes from transforming that data into timely, trusted, and actionable insights.
Consistency Builds Confidence
Executive confidence increases dramatically when every department works from the same business definitions and trusted datasets.
Automation Enables Better Analysis
Reducing manual reporting allows analysts to spend more time understanding business trends and supporting strategic initiatives.
Predictive Intelligence Creates Competitive Advantage
Organizations that anticipate future business conditions consistently outperform those that rely solely on historical reporting.
Business Intelligence Is a Business Strategy
The most successful implementations treat Business Intelligence as an organizational capability rather than simply another IT project.
Conclusion
Organizations rarely struggle because they lack data.
More often, they struggle because valuable information is scattered across disconnected systems, inconsistent reports, and manual processes that slow decision-making.
A Unified Business Intelligence Platform addresses this challenge by creating a trusted foundation for enterprise data.
By integrating operational systems, standardizing business metrics, automating reporting, and introducing predictive analytics, organizations can transform fragmented information into actionable business intelligence.
The result extends far beyond improved dashboards.
Leadership gains faster access to trusted insights.
Operational teams respond proactively to emerging risks.
Analysts spend less time preparing reports and more time generating value.
Most importantly, the organization develops the confidence to make strategic decisions based on reliable, timely information.
In an increasingly data-driven world, the organizations that succeed will not necessarily be those with the most data, but those that can transform data into meaningful business action faster than their competitors.
Related Searches
- A Leading Logistics Platform Achieved 30% Faster Incident Resolution with AI-Driven Observability
- Driving 40% Faster Resolution with AI Across One of Asia’s Largest Digital Businesses
- 3× Faster Issue Resolution Through Smarter Operational Intelligence
- What Is Agentic AI Data Engineering?- How AI Agents Automate ETL Pipelines
Related Solutions
- internal developer platform migration
- Kubernetes production support services
- zero downtime database migration services
- multi-cloud application delivery platform
Frequently Asked Questions
What is a Unified Business Intelligence Platform?
A Unified Business Intelligence Platform consolidates data from multiple business systems into a centralized analytics environment, providing organizations with consistent reporting, standardized KPIs, and actionable insights for decision-making.
Why is a Single Source of Truth important?
A Single Source of Truth ensures that all departments work with consistent business definitions and trusted datasets, eliminating conflicting reports and improving confidence in decision-making.
How does Business Intelligence improve decision-making?
Business Intelligence provides timely access to trusted information, enabling organizations to identify operational trends, monitor performance, and respond more quickly to changing business conditions.
Is Business Intelligence only for large enterprises?
No. Organizations of all sizes benefit from centralized reporting, automated analytics, and improved visibility. The complexity of the implementation varies based on business requirements and data maturity.
What is the difference between reporting and Business Intelligence?
Reporting focuses on presenting historical information.
Business Intelligence combines historical reporting, operational visibility, and advanced analytics to support informed and proactive business decisions.
About Merit Incentives
Merit Incentives , Data Intelligence & Cloud Engineering Practice
At Merit Incentives, we help organizations modernize their data ecosystems by designing cloud-native data platforms, enterprise Business Intelligence solutions, analytics modernization initiatives, and AI-driven decision support systems.
Our expertise spans AWS data engineering, data lakes, data warehouses, Business Intelligence, predictive analytics, enterprise reporting, and performance optimization. By combining deep technical expertise with practical implementation experience, we enable organizations to transform fragmented business data into actionable insights that support sustainable growth.
Reference Sources
- WS – Modern Data Strategy
https://aws.amazon.com/big-data/datalakes-and-analytics/modern-data-strategy/ - AWS – Analytics Lens
https://docs.aws.amazon.com/wellarchitected/latest/analytics-lens/ - Microsoft Learn – Power BI Guidance
https://learn.microsoft.com/power-bi/guidance/ - Google Search Central – Creating Helpful, Reliable, People-First Content
https://developers.google.com/search/docs/fundamentals/creating-helpful-content