 OpsTree AI Experience Center
Explore Now →
OpsTree AI Experience Center
Explore Now →


Business Observability
Revenue Is Moving Right Now. Are You Watching It?
Business Observability gives enterprises real-time visibility into the KPIs and customer journeys that drive growth — not next week's report, not end-of-day summaries. Right now, as it happens.
On Track
Normal
↓ 18% drop
Watch
Conversion in APAC dropped 18% in the last hour. Root cause: CKYC bureau API latency at 18s+ for 2 operators. Revenue at risk: $4.2M. Remediation recommended.
You have dashboards. You don't have visibility.
Most enterprise teams know something went wrong when a customer complains, a revenue metric drops in the weekly review, or an analyst surfaces a trend from last Tuesday's data. By then, the cost is already counted.
Three capabilities that make your business visible in real time
Business Observability isn't a monitoring tool — it's a live intelligence layer across your customer journey, your KPIs, and your revenue. Built for business leaders, not just engineering teams.

Real-Time Business KPIs
Live metrics at every stage of your business — revenue, conversion rates, NPS, cohort behavior, and supplier performance — updating as events happen, not as reports are generated.
- Revenue tracking by segment, region, and channel
- Conversion monitoring across the full funnel
- Cohort behavior and NPS in real time
- Inventory and supplier performance live

Customer Journey Observability
Drop-off detection, path analysis, cohort segmentation, and time-to-action tracking across every stage of the customer journey - from first touch to retention and repurchase.
- Drop-off detection at every funnel stage
- Path analysis across touchpoints
- Cohort segmentation and time-to-action
- Cross-channel journey stitching

Predictive Alerts
Detect anomalies on business KPIs before they impact results — not after. AI-powered correlation identifies what's changing, why it's changing, and what's at risk if left unaddressed.
- Anomaly detection with business context
- AI root cause identification in <60s
- Revenue-at-risk quantification
- Automated remediation recommendations
Every customer journey stage — visible, traceable, recoverable
OpsTree maps the full customer journey into a live, instrumented pipeline. Every stage is monitored. Every drop-off is detected. Every root cause is surfaced — automatically.
From signal to action — in under 60 seconds
Business Observability doesn't just show you what's happening. It tells you what's causing it and what to do about it - automatically.
Instrument every stage of the customer journey
OpsTree instruments your customer journey end-to-end — onboarding, KYC, conversion, disbursal, repayment, retention. Every event is tracked. Every handoff is visible.
End-to-End InstrumentationEnd-to-End Instrumentation
Revenue, conversion, NPS, inventory, supplier performance — all metrics flow live into executive dashboards and business-function views. No waiting for ETL jobs to finish overnight.
Real-Time KPI StreamingAI detects anomalies and quantifies business impact instantly
When conversion drops 18% in APAC, the AI correlation layer fires in under 60 seconds — flagging revenue at risk ($4.2M), identifying the root cause (CKYC API latency), and recommending remediation.
AI-Powered Correlation LayerRoot cause is diagnosed — not just flagged
The platform diagnoses what's causing the anomaly across connected systems. Was it an SMS gateway failure? A payment API timeout? ML scoring backlog? Root cause identified, business impact quantified, auto-remediation triggered.
Root Cause DiagnosisCIO and COO see it all in one command center view
The executive command center gives CIOs and COOs a live view of revenue at risk, open P1/P2 incidents, pipeline health by stage, and SLA breach status — all in one screen, always current.
Executive Command CenterWhat changes when your business becomes observable
These results come from live Business Observability deployments across e-commerce, BFSI, and telecom enterprises.
Built for businesses where the customer journey is the revenue engine
Business Observability is for the organizations where a one-hour blind spot costs real money.

CIOs & COOs
Running a business-critical pipeline with no real-time view of where revenue is leaking — and finding out in the post-mortem.
Product & Digital Leaders
Conversion experiments running blind — no live signal on whether a funnel change is helping or hurting, until Monday's cohort report.
Operations & Risk Teams
Fraud signals buried in system logs. Supplier failures invisible until they cascade. SLA breaches discovered after the customer complains.
How a Gift Card Commerce Leader Cut Decision Time by 80% with Unified Business Intelligence
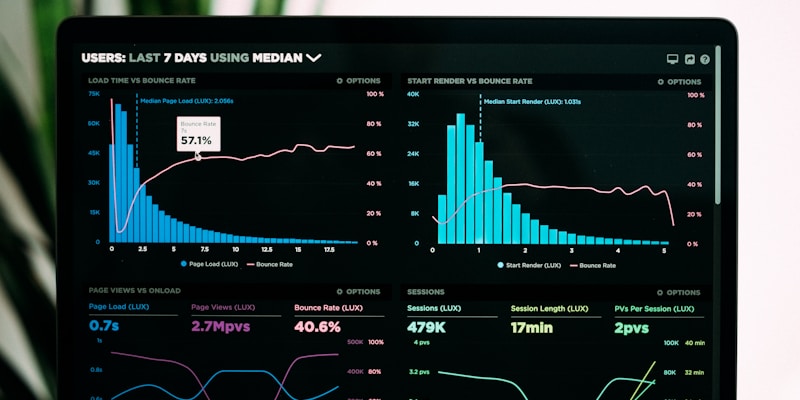
Millions of transactions. Zero real-time visibility.
A rapidly scaling gift card and commerce business managed millions of daily transactions across suppliers, inventory systems, customer redemption platforms, and financial operations. Leadership relied on manually generated reports from different departments. By the time insights reached decision-makers, the window to act had already closed — on fraud, on stock risk, on supplier failures.
A live intelligence platform — not another reporting layer
OpsTree consolidated data across all operational and financial systems into a single, real-time observability platform — with predictive capabilities for inventory, fraud, and supplier risk.
- ✓ Executive dashboards delivering live supplier performance, inventory movement, redemption trends, and transaction activity
- ✓ Predictive insights for demand forecasting, supplier float management, and fraud risk — acting before issues impacted customers
- ✓ Automated intelligence that eliminated the manual reporting pipeline entirely
- ✓ Greater executive confidence with one source of truth across all departments
Questions enterprises ask before deploying Business Observability
Real answers — not marketing copy.
Our engineering team is here to help. Browse our documentation or get in touch to discuss your specific situation.
Explore More OpsTree Business Solutions
Business Observability is one layer of a connected intelligence stack.
Stop finding out what happened. Start seeing it happen.
We'll show you what Business Observability looks like running on your customer journey — live metrics, real-time alerts, and root cause intelligence built for your business.