
ClickHouse is an open-source database that is incredibly fast for analyzing data. It is specially designed for analytics and time-series data (like sales trends, website traffic, or sensor readings). It’s called an OLAP (Online Analytical Processing) database, which means it can run big analytical queries instantly and performs excellently for data warehousing and analysis tasks.
In the DevOps world, applications and infrastructure continuously generate a huge number of logs and metrics. As this data grows rapidly, traditional databases often struggle to store and analyse it efficiently. This is where ClickHouse really stands out. It is designed to handle large volumes of data at high speed, making it much easier for DevOps teams to analyse logs and metrics without performance issues.
Why DevOps Teams Need ClickHouse?
High Ingestion Rate
In DevOps, logs and metrics are generated continuously and in very large volumes. ClickHouse can handle this load easily by ingesting millions of records per second without slowing down. This ensures that no important data is missed, even during peak traffic.
Fast Analytics
ClickHouse is built to run analytical queries very fast with large volumes of data and return results in seconds which help us to quickly analyze errors, latency, and performance.
Cost – effective Storage
It stores data in a compressed format, which takes less disk space and reduces storage costs significantly, making it affordable to store large amounts of logs and metrics for a longer time.
Real Time Trouble shooting
When an issue occurs in production, teams need answers quicky. ClickHouse allows real-time querying fresh data, helping DevOps engineers quickly identify what went wrong and take action.
Where ClickHouse Fits in DevOps Stack?
In a DevOps environment, systems generate a huge amount of data in the form of logs, metrics, and traces . ClickHouse acts as a high-performance analytics database that sits between data collection tools and visualization platforms.
DATA FLOW:
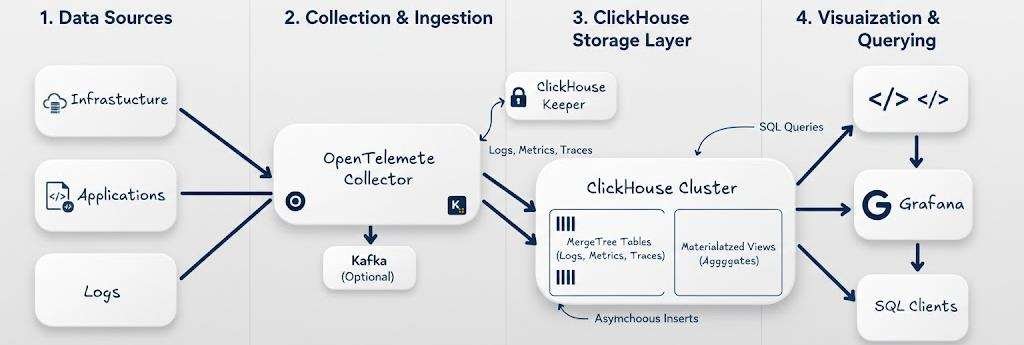
1. Data Sources
Applications and infrastructure generate large amounts of observability data such as logs, metrics, and traces.
2. Collection & Ingestion Layer
Open Telemetry Collector or Fluent bit collects data from different sources and forwards it to downstream systems. Optionally, Kafka can be used as a buffer to handle high data volume and provide reliable ingestion.
3. ClickHouse Storage Layer
ClickHouse acts as the main analytics storage engine.
- Data is stored in MergeTree tables for fast analytical queries.
- Materialized views are used for pre-aggregated data and faster dashboards.
- ClickHouse Keeper provides coordination and metadata management for the cluster.
- Asynchronous inserts help handle high ingestion rates efficiently.
4. Visualization & Querying
Grafana and SQL clients query ClickHouse to visualize metrics, logs, and traces. This layer enables
- Real-time dashboards
- Monitoring and alerting
- Interactive SQL analytics
Transform your business with DevOps services focused on automation, observability, cloud infrastructure, and performance optimization.
ClickHouse vs Elasticsearch: The key differences
Here is some key difference:
| Criteria | ClickHouse | Elasticsearch |
|---|---|---|
| Architecture | Columnar database designed for analytical (OLAP) workloads, optimized for fast reads and large-scale data processing. | Distributed document store optimized for full-text search and real-time search analytics. |
| Data Storage | Stores data in compressed columnar format, reading only required columns for faster analytics. | Stores data as JSON documents with flexible schema, optimized for search and indexing. |
| Indexing | Minimal traditional indexing; relies on columnar storage and data ordering for fast scans. | Heavy indexing to enable fast keyword and pattern-based searches. |
| Scalability | Scales horizontally to handle petabytes of analytical data with high performance. | Horizontally scalable with built-in replication and fault tolerance for search workloads. |
| Security | Basic authentication and access control; enterprise setups often add external security layers. | Advanced built-in security features including RBAC, encryption, and audit logging. |
| Use Cases | Large-scale analytics, time-series data, real-time dashboards, event analytics. | Full-text search, log search, monitoring, and search-driven applications. |
Column Store Data
In DevOps, most queries focus on specific fields (columns) instead of entire records. For example, often query:
- status_code → to find error rates (200, 500, 503)
- latency → to analyze slow requests
- service_name → to identify which service is causing issues
Since ClickHouse stores data columns by column, it reads only the required columns instead of scanning the entire row. This significantly reduces disk I/O and speeds up query execution.
Clickhouse Architecture
This architecture explains how ClickHouse efficiently parses queries, executes them in parallel, and stores data in a compressed columnar format.
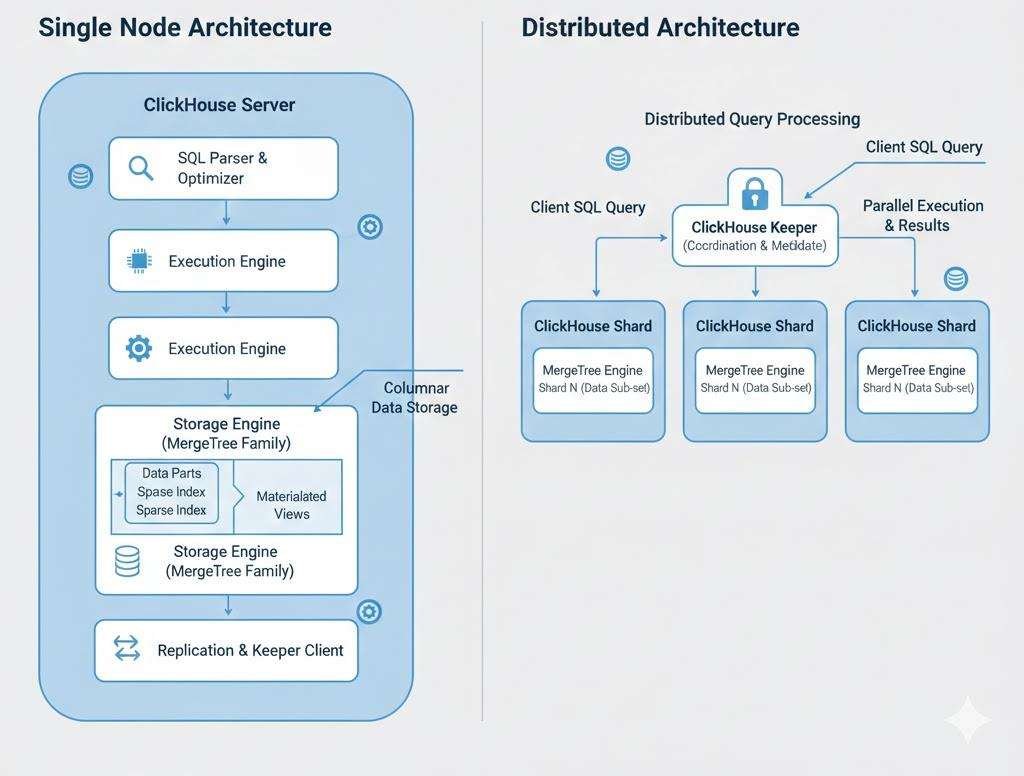
Single Node Architecture
This diagram represents the internal architecture of a single ClickHouse server node and shows how queries are processed, and data is stored.
Here is the key component of single node architecture:
SQL Parser & Optimizer:
The SQL parser reads and understands the query written by the user and optimizer analyzes the query and decides the most efficient execution plan to reduce query time and resource usage.
Execution Engine
The execution engine runs the optimized query and processes data in parallel using multiple CPU cores, which makes ClickHouse extremely fast for analytical workloads.
Storage Engine
The storage engine is responsible for storing data on disk & ClickHouse mainly uses MergeTree-based engines, which are optimized for large-scale analytical queries.
Data Parts
Data is stored in parts, which are immutable chunks of data on disk & ClickHouse continuously merges smaller parts into larger ones to improve query performance.
Indexes (Sparse Indexes)
ClickHouse uses sparse indexes instead of traditional B-Tree indexes & these indexes help skip unnecessary data blocks, speeding up queries without heavy storage overhead.
Materialized Views
Materialized views store pre-aggregated data. They are used to speed up dashboards and analytics queries by avoiding repeated heavy computations.
Replication & Keeper Client
This component handles replication and coordination when ClickHouse runs in a cluster.
ClickHouse Keeper (like Zookeeper) manages metadata, replicas, and distributed coordination.
Distributed Click House Architecture
In distributed mode, Click House scales horizontally using multiple nodes called shards.
Here is the key component of Distributed architecture :
1. Click House Shards
Each shard stored a subset of data using Merge Tree tables. Data is distributed across shards to handle large datasets.
2. Click HouseKeeper
ClickHouse Keeper handles coordination, metadata, and replication (like Zookeeper).
3. Distributed Query Processing
When a client sends a query, Click House splits the query across multiple shards, executes it in parallel, and merges the results.
4. Parallel Execution
Each shard processes its part of the data simultaneously, which significantly reduces query latency.
How to Set up Click House
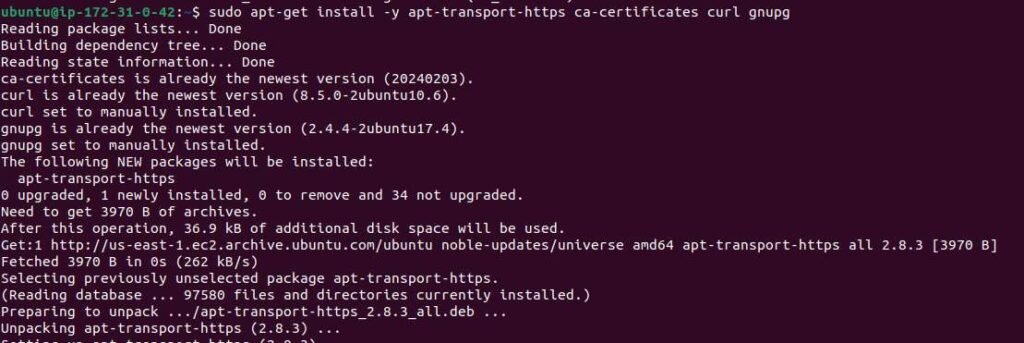
Step 1: Install prerequisite packages
sudo apt-get install -y apt-transport-https ca-certificates curl gnupg
Step 2: Download the ClickHouse GPG key and store it in the key ring
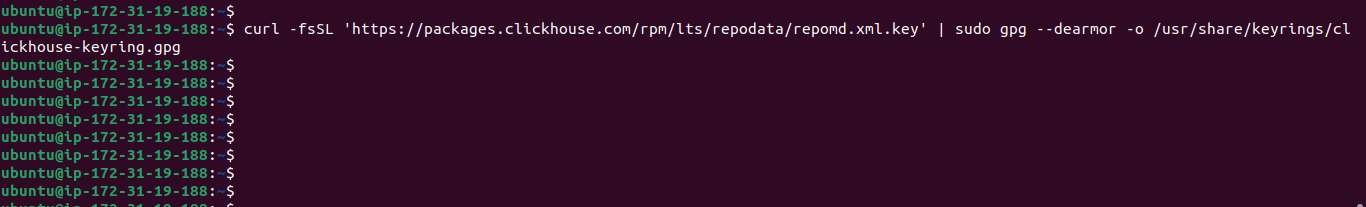
curl -fsSL 'https://packages.clickhouse.com/rpm/lts/repodata/repomd.xml.key' | sudo gpg --dearmor -o /usr/share/keyrings/clickhouse-keyring.gpg
Step 3: Get the system architecture
ARCH=$(dpkg --print-architecture)

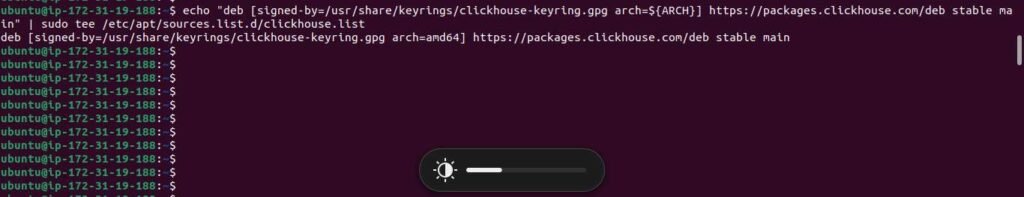
Step 4: Get the system architecture
echo "deb [signed-by=/usr/share/keyrings/clickhouse-keyring.gpg arch=${ARCH}] https://packages.clickhouse.com/deb stable main" | sudo tee /etc/apt/sources.list.d/clickhousez.vlist
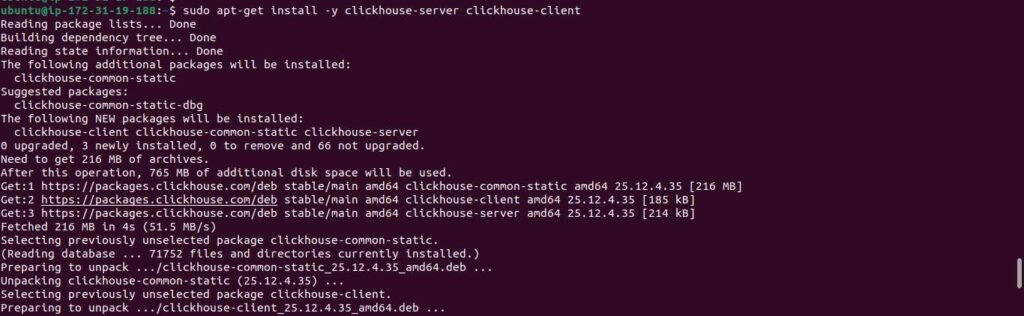
Step 5: Get the system architecture
sudo apt-get install -y clickhouse-server clickhouse-client
 Step 6: Get the system architecture
sudo service clickhouse-server start
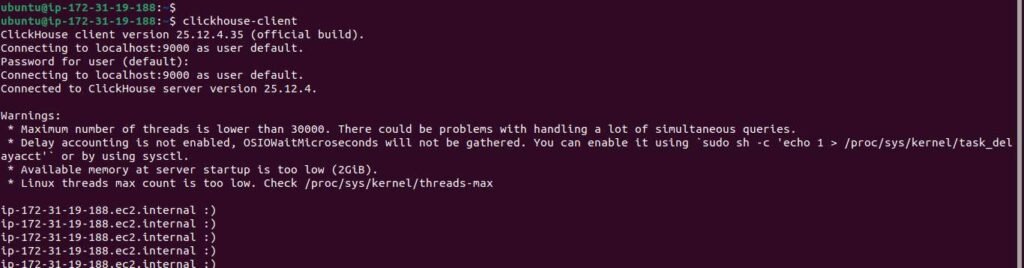
 Step 7: Get the system architecture
clickhouse-client
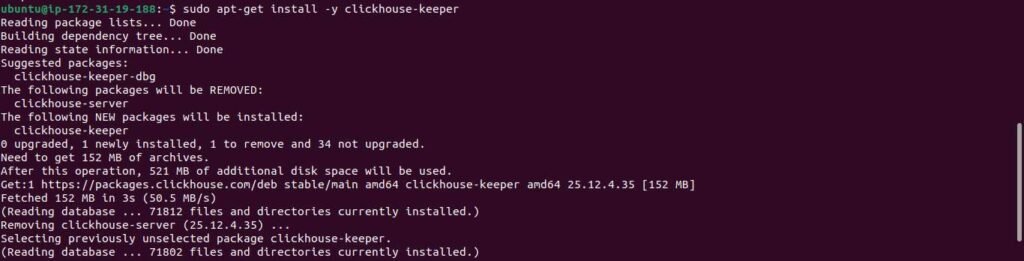
Step 8: Install standalone Clickhouse Keeper
NOTE: In production, ClickHouse Keeper should run on dedicated nodes for better reliability and availability. In test environments, it can run on the same server as ClickHouse Server since it is included by default.
sudo apt-get install -y clickhouse-keeper
Step 9: Enable and start Clickhouse keeper
sudo systemctl enable clickhouse-keeper
sudo systemctl start clickhouse-keeper
sudo systemctl status clickhouse-keeper