

In the previous part of this series, we explored K8sGPT as a CLI tool, where we manually executed diagnostics to identify Kubernetes issues and receive AI-generated explanations and remediation suggestions.
While the CLI approach is lightweight and excellent for learning and on-demand troubleshooting, it has one major limitation: it requires a human to trigger the analysis every time.
Production Kubernetes environments are highly dynamic. New Pods are created constantly, Deployments are updated frequently, and configuration changes can introduce unexpected failures at any time. In such environments, we need a system that continuously watches the cluster, automatically detects issues, and integrates with existing monitoring platforms.
This is where the K8sGPT Operator comes into the picture.
What is the K8sGPT Operator?
The K8sGPT Operator brings AI-powered Kubernetes diagnostics directly into the cluster using the Kubernetes Operator pattern.
Instead of running k8sgpt analyze manually, the operator continuously manages K8sGPT workloads through Kubernetes Custom Resources (CRDs). Administrators define what should be analyzed using YAML manifests, and the operator ensures that K8sGPT runs according to this desired configuration.
This enables:
- Automated cluster-wide diagnostics
- Continuous health analysis
- AI-generated explanations and remediation recommendations
- Integration with monitoring systems such as Prometheus and Grafana
- Easier adoption in production environments
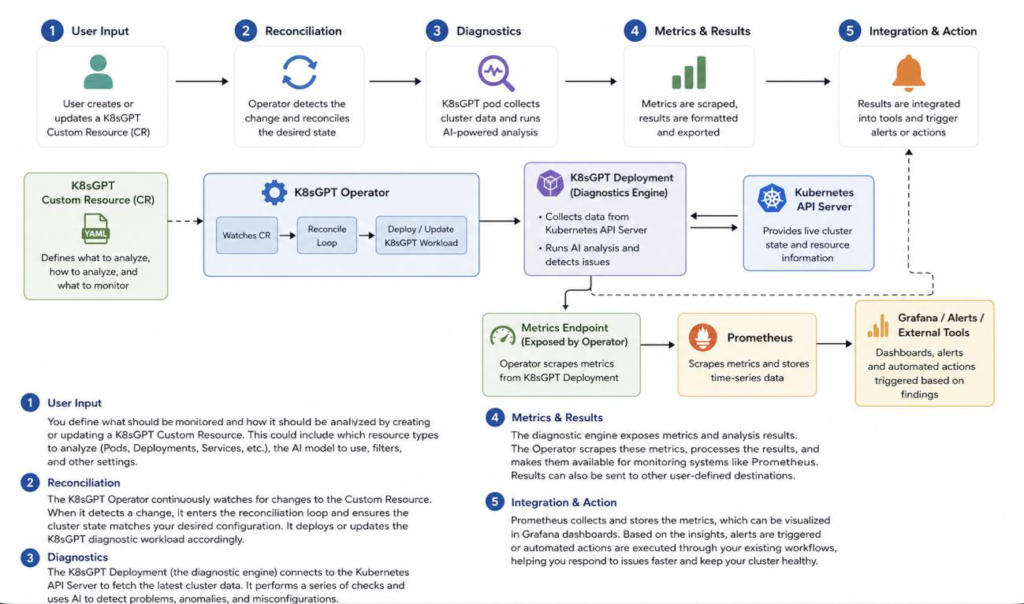
K8sGPT Operator Architecture
The K8sGPT Operator acts as the bridge between Kubernetes resources, the AI diagnostic engine, and observability tools.
The architecture consists of the following components:
1. Custom Resource Definition (CRD)
The K8sGPT CRD extends Kubernetes with a new resource type called K8sGPT.
Using this resource, users can declaratively specify:
- Which AI backend should be used
- Which Kubernetes resources should be analyzed
- Model configuration
- Analysis behavior and filtering options
The desired configuration is stored as Kubernetes YAML, following the standard Kubernetes declarative model.
2. K8sGPT Operator
The operator continuously watches the Kubernetes API for changes to K8sGPT Custom Resources.
Its responsibilities include:
- Creating and managing K8sGPT diagnostic workloads
- Ensuring the actual cluster state matches the desired state
- Collecting analysis results
- Exposing Prometheus-compatible metrics
- Managing integrations with external observability systems
3. K8sGPT Diagnostic Deployment
The K8sGPT deployment is the AI-powered diagnostic engine.
It communicates with the Kubernetes API Server to gather information about cluster resources such as:
- Pods
- Deployments
- Services
- StatefulSets
- Events
It then analyzes this information using the configured AI model to identify problems and suggest possible solutions.
4. Kubernetes API Server
The Kubernetes API Server provides the real-time state of the cluster.
K8sGPT queries the API server to collect resource information, detect anomalies and understand the current health of Kubernetes objects.
5. Prometheus and Grafana Integration
The operator exposes metrics that can be scraped by Prometheus.
These metrics can be:
- Visualized using Grafana dashboards
- Used for alerting rules
- Integrated into existing observability workflows
This allows AI-generated cluster insights to become part of the standard monitoring pipeline.
K8sGPT Operator – Step-by-Step Workflow
Here’s how the K8sGPT Operator works from the moment you define your intent to the time you get Al-powered insights and automated actions.
Deploy Ollama in Kubernetes
Since we will be using a local LLM for K8sGPT analysis, we need to deploy Ollama inside the Kubernetes cluster. In the previous part of this series, we already deployed Ollama while configuring K8sGPT CLI. However, if you are directly starting with the K8sGPT Operator setup, you must deploy Ollama before configuring K8sGPT.
Ollama is a lightweight tool that allows you to download, manage, and run Large Language Models (LLMs) locally.
Create a file called: ollama.yaml
And add the below manifest to the file:
apiVersion: v1
kind: Namespace
metadata:
  name: ollama

---
apiVersion: v1
kind: PersistentVolumeClaim
metadata:
  name: ollama-storage
  namespace: ollama

spec:
  accessModes:
    - ReadWriteOnce
  resources:
    requests:
      storage: 8Gi

---
apiVersion: apps/v1
kind: Deployment
metadata:
  name: ollama
  namespace: ollama

spec:
  replicas: 1

  selector:
    matchLabels:
      app: ollama

  template:
    metadata:
      labels:
        app: ollama

    spec:
      containers:
        - name: ollama
          image: ollama/ollama:latest

          imagePullPolicy: IfNotPresent

          ports:
            - containerPort: 11434

          env:
            - name: OLLAMA_KEEP_ALIVE
              value: "30m"

          resources:
            requests:
              memory: "1Gi"
              cpu: "500m"

            limits:
              memory: "2Gi"
              cpu: "1"

          volumeMounts:
            - name: ollama-storage
              mountPath: /root/.ollama

          startupProbe:
            tcpSocket:
              port: 11434
            failureThreshold: 30
            periodSeconds: 10

          readinessProbe:
            tcpSocket:
              port: 11434
            initialDelaySeconds: 5
            periodSeconds: 10

          livenessProbe:
            tcpSocket:
              port: 11434
            initialDelaySeconds: 30
            periodSeconds: 20

      volumes:
        - name: ollama-storage
          persistentVolumeClaim:
            claimName: ollama-storage

---
apiVersion: v1
kind: Service
metadata:
  name: ollama
  namespace: ollama

spec:
  type: ClusterIP

  selector:
    app: ollama

  ports:
    - port: 11434
      targetPort: 11434
Deploy the Resources
kubectl apply -f ollama.yaml
Verify Deployment:
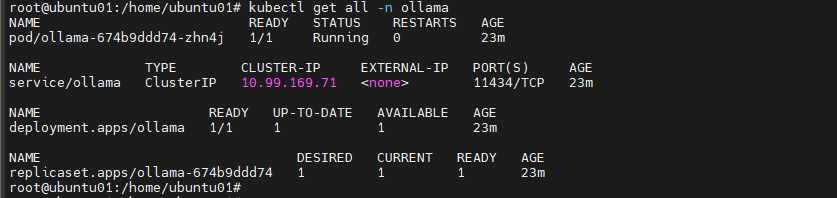
kubectl get all -n ollama
Download the TinyLlama Model
NOTE: We are using TinyLlama for demonstration purposes. For production environments and improved diagnostic accuracy, consider using the latest Llama models or other more powerful LLMs.
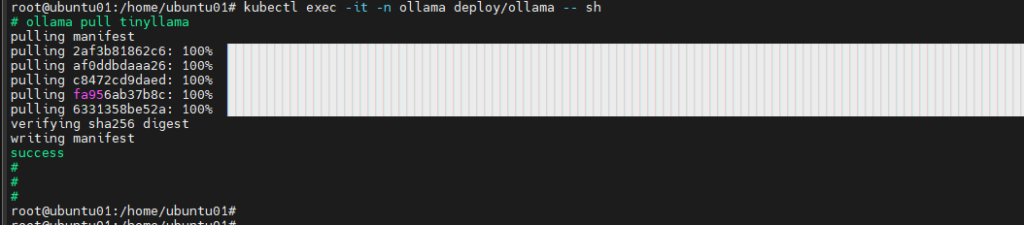
Access the Ollama container:
kubectl exec -it -n ollama deploy/ollama -- sh
Pull the TinyLlama model:
ollama pull tinyllama
Exit the container:
exit
Deploy Prometheus and Grafana
To monitor K8sGPT metrics, install the Prometheus Kubernetes monitoring stack.
Add the Prometheus Repository
helm repo add prometheus-community \
https://prometheus-community.github.io/helm-charts
helm repo update
Create a Monitoring Namespace
kubectl create namespace monitoring
Install kube-prometheus-stack
helm upgrade --install prometheus \
prometheus-community/kube-prometheus-stack \
--namespace monitoring \
--set prometheus.prometheusSpec.serviceMonitorSelectorNilUsesHelmValues=false
Verify the installation:
kubectl get pods -n monitoring

Check the available services:
kubectl get svc -n monitoring
Installing the K8sGPT Operator
The easiest way to install the operator is through Helm.
Install Helm
curl -fsSL -o get_helm.sh \
https://raw.githubusercontent.com/helm/helm/main/scripts/get-helm-3

chmod 700 get_helm.sh

./get_helm.sh
Verify installation:
helm version
Add the K8sGPT Helm Repository
helm repo add k8sgpt https://charts.k8sgpt.ai/
helm repo update
Install the Operator
For production environments, it is recommended to enable additional observability components:
helm upgrade --install release \
k8sgpt/k8sgpt-operator \
-n k8sgpt-operator-system \
--create-namespace \
--set interplex.enabled=true \
--set grafanaDashboard.enabled=true \
--set serviceMonitor.enabled=true
This enables:
- Interplex integration – Allows K8sGPT analysis results to be integrated with external monitoring and observability systems.
- Grafana dashboards – Provides ready-to-use dashboards to visualize K8sGPT metrics and AI-generated cluster insights.
- Prometheus ServiceMonitor resources – Automatically enables Prometheus to discover and scrape K8sGPT metrics for monitoring and alerting.
After successfully deploying the K8sGPT Operator, verify that the k8sgpt-operator pod is running in the k8sgpt-operator-system namespace.
You can verify it using:
kubectl get pods -n k8sgpt-operator-system

Configuring K8sGPT with Ollama as the AI Backend
One of the major advantages of K8sGPT Operator is the ability to use local AI models through tools like Ollama.
By running the model locally, organizations can keep Kubernetes diagnostics private without sending cluster information to external AI services.
Create a K8sGPT custom resource:
$ vi k8sgpt-ollama.yaml # Create file and add below yamls
apiVersion: core.k8sgpt.ai/v1alpha1
kind: K8sGPT
metadata:
  name: k8sgpt-ollama
  namespace: k8sgpt-operator-system
spec:
  ai:
    enabled: true
    model: llama3 # Change this with your LLM name
    backend: localai
    baseUrl: http://ollama.ollama.svc.cluster.local:11434/v1 # Change with Ollama service endpint
  noCache: false
  repository: ghcr.io/k8sgpt-ai/k8sgpt
  version: v0.3.41
Apply the configuration:
kubectl apply -f k8sgpt-ollama.yaml
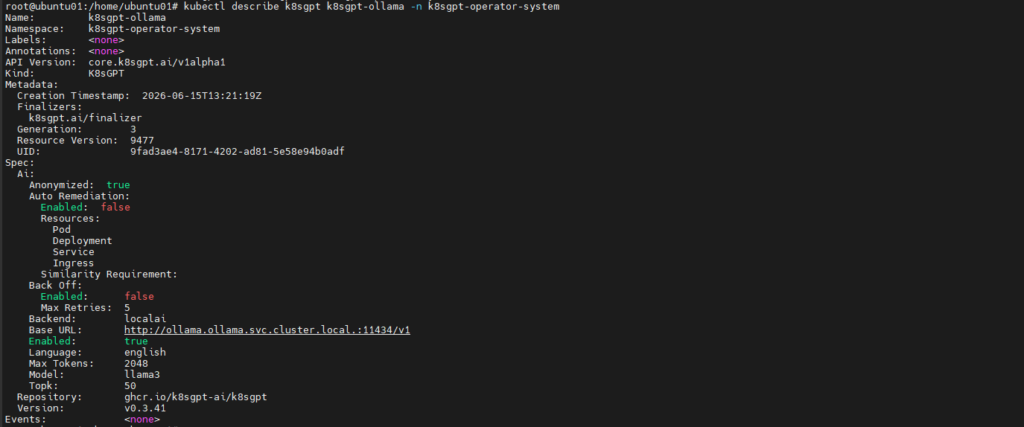
Verify the K8sGPT resource:
kubectl describe k8sgpt k8sgpt-ollama \
-n k8sgpt-operator-system
Verify the K8sGPT Diagnostic Pod
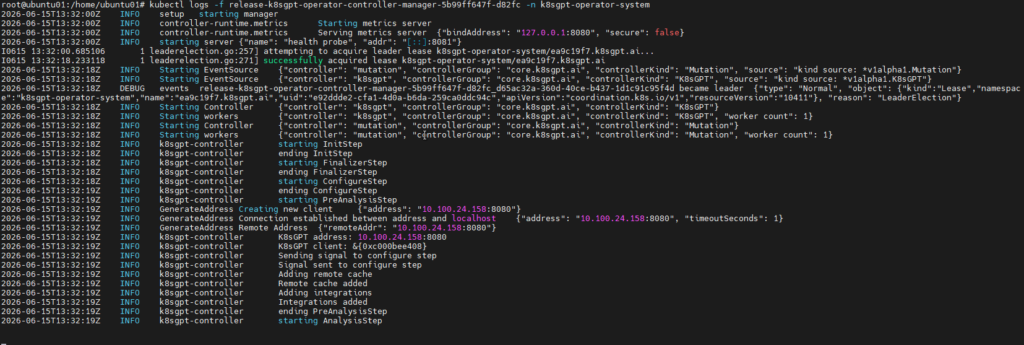
Once the operator processes the Custom Resource, it automatically creates a K8sGPT diagnostic pod.
Check the pod:
kubectl get pods -n k8sgpt-operator-system

Example output:
NAME                                READY   STATUS    RESTARTS   AGE
k8sgpt-ollama-66d48ccb5d-vdtwk      1/1     Running   0          2m
The running pod continuously communicates with the Kubernetes API Server and performs AI-driven diagnostics.
Viewing AI Analysis Results
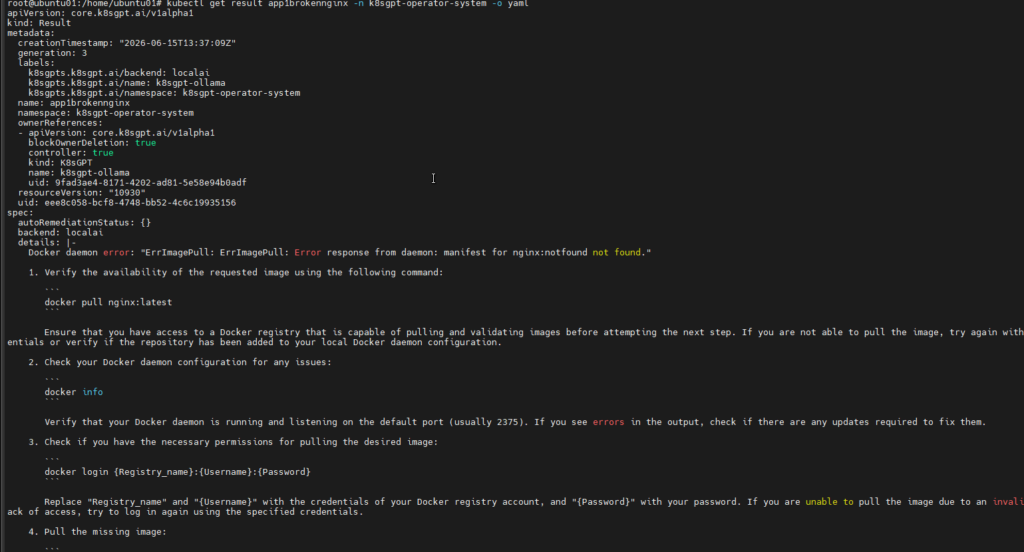
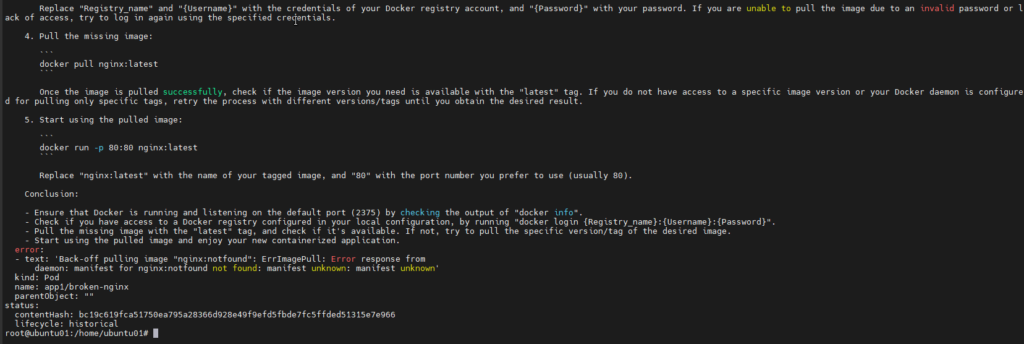
After K8sGPT completes its analysis, the results are stored as Kubernetes Result custom resources.
You can list all generated results:
kubectl get results –A

To view results within the K8sGPT namespace:
kubectl get results \
-n k8sgpt-operator-system
For detailed JSON output:
kubectl get results \
-n k8sgpt-operator-system \
-o json | jq .
The output includes:
- Affected Kubernetes resource
- Detected issue
- Root cause analysis
- AI-generated remediation recommendations
Access the Prometheus Dashboard
Forward the Prometheus service locally:
kubectl port-forward \
-n monitoring \
svc/prometheus-kube-prometheus-prometheus \
9090:9090 \
--address 0.0.0.0
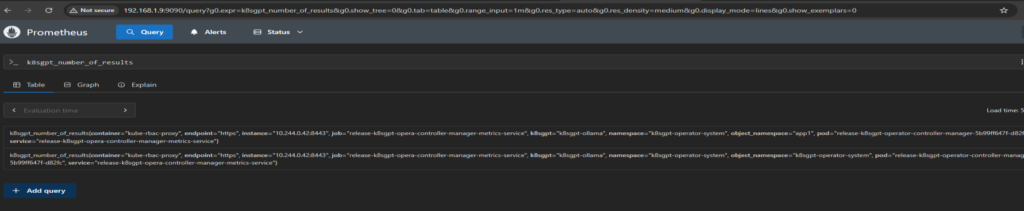
Now access Prometheus using:
Prometheus can now scrape K8sGPT metrics, enabling dashboards, alerts, and deeper visibility into AI-generated cluster diagnostics.
K8sGPT CLI vs K8sGPT Operator
| Feature | K8sGPT CLI | K8sGPT Operator |
|---|---|---|
| Execution Model | Manual | Continuous |
| Installation | Local machine | Kubernetes cluster |
| Analysis | On-demand | Automated |
| Production Ready | Limited | Yes |
| Monitoring Integration | Manual | Prometheus/Grafana |
| Best Use Case | Learning, debugging | Production environments |
Conclusion
K8sGPT significantly simplifies Kubernetes troubleshooting by converting complex Kubernetes failures into understandable explanations and actionable solutions.
The CLI version is an excellent tool for developers who need quick, on-demand diagnostics. However, for production environments where failures can happen at any moment, the K8sGPT Operator provides a far more powerful approach by continuously analyzing the cluster, exposing metrics, and integrating with existing observability platforms.
By combining K8sGPT Operator, Ollama, and Prometheus, organizations can build a completely self-hosted AI-powered Kubernetes troubleshooting platform that provides intelligent diagnostics while keeping cluster data inside their own infrastructure.
Related Searces
- Flagd on Kubernetes: Complete Production Guide to Architecture, Implementation and Troubleshooting
- Kubernetes Events Monitoring using Open Telemetry And Loki
- A Complete Traffic Flow Guide to Using Kong Gateway in Kubernetes