 OpsTree AI Experience Center
Explore Now →
OpsTree AI Experience Center
Explore Now →


Revenue Customer Intelligence
Your Data Knows Where Revenue Is Leaking. Does Your Business?
OpsTree turns fragmented enterprise data into a unified intelligence platform — surfacing churn signals before customers leave, revenue leakage before it compounds, and growth opportunities before competitors find them.
Ingesting
Ingesting
Ingesting
Ingesting
Your data is in ten places. Your revenue insights are in none.
Most enterprises generate enormous amounts of customer, transaction, and operational data — spread across CRM, e-commerce, finance, and rewards platforms. The problem isn't data volume. It's that no one can see across all of it at once.
Two core use cases. One unified data platform. Built on AWS.
OpsTree doesn't just connect your data — it engineers a governed, cloud-native intelligence platform that turns fragmented systems into a single source of growth and retention intelligence.

Customer 360 & Unified Data Platform
A single source of truth across all structured and unstructured customer data — governed ingestion, transformation, and analytics on AWS. Every team works from the same numbers, the same definitions, the same customer view.
Automated ingestion from CRM, rewards, e-commerce, and finance systems
Centralized AWS S3 data lake with historical trend data
ETL pipelines using AWS Glue and PySpark — automated, governed, scalable
Self-service dashboards in Grafana/Metabase for every business function
AI-ready, governed data foundation for downstream ML models

Revenue Leakage & Churn Detection
Multi-system correlation that detects hidden revenue gaps before they compound. Predictive alerts with business-readable root cause insights — so revenue protection becomes proactive, not reactive.
Cross-system revenue gap detection — billing, redemption, partner discrepancies
Predictive churn scoring with leading behavioral indicators
Business-readable alerts with root cause and recommended action
Automated investigation workflows — from signal to insight in minutes
Revenue recovery tracking with closed-loop validation
Every customer journey stage — visible, traceable, recoverable
OpsTree maps the full customer journey into a live, instrumented pipeline. Every stage is monitored. Every drop-off is detected. Every root cause is surfaced — automatically.
From fragmented data to unified revenue intelligence
Five engineering layers that turn your scattered data into a governed, AI-ready platform — built on AWS, delivered end-to-end by OpsTree.
Data extracted from every source system — automatically
OpsTree connects to your CRM, rewards platform, e-commerce layer, and finance systems. Automated ingestion using AWS Glue pulls data on schedule — standardized, validated, and consistently formatted before it touches the lake.
A single data lake becomes the enterprise's source of truth
All source data lands in a centralized AWS S3 lake — historical, current, and real-time. Business definitions are standardized here: "revenue" means the same thing to Finance, Sales, and Product. Historical data is preserved for trend analysis and ML training.
ETL pipelines cleanse, enrich, and apply business rules
AWS Glue and PySpark pipelines run automated cleansing, enrichment, and aggregation. Business rules for incentive calculations, revenue recognition, and churn scoring are applied consistently — no manual intervention, no analyst bottleneck.
Revenue leakage and churn signals surface automatically
AI correlation runs across connected datasets — detecting billing mismatches, redemption anomalies, and behavioral churn signals before they become revenue losses. Alerts arrive with business-readable root cause and recommended action, not just a flagged row in a database.
Business teams get self-service dashboards — no analyst dependency
Executive dashboards and business-function views in Grafana and Metabase give every team near real-time visibility into program performance, customer engagement, and incentive redemption. Self-service reporting replaces the request queue entirely.
How a Leading Incentive Management Enterprise Transformed Fragmented Reporting into Real-Time Revenue Intelligence
Retail / Gift Cards / Incentive Management · India
Built for enterprises where data fragmentation is costing revenue
If your teams are making decisions from different versions of the same data — this platform was built for you.
CFOs & Revenue Leaders
Revenue leakage is happening somewhere in the business — billing gaps, redemption anomalies, partner discrepancies. Finding it takes weeks and a forensic analyst.
Marketing & CRM Leaders
Customer segmentation is built on incomplete data. Churn campaigns target last month's signals. Personalization is limited by fragmented customer records across systems.
Data & Analytics Teams
Analyst time consumed by manual reconciliation, report generation, and data quality firefighting — leaving no capacity for actual analysis and insight work.
How a Gift Card Commerce Leader Cut Decision Time by 80% with Unified Business Intelligence
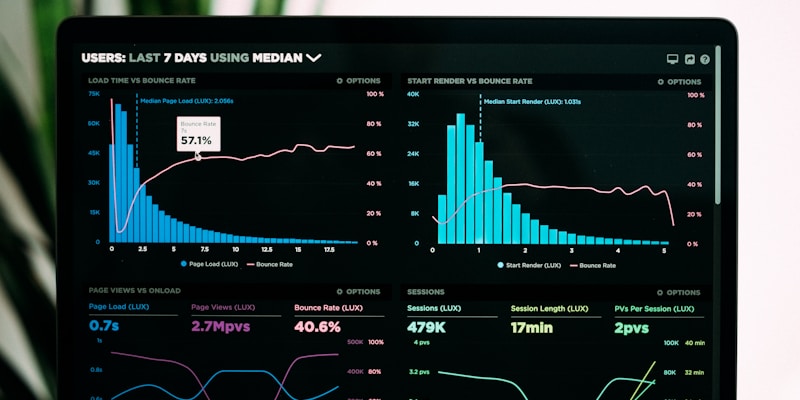
Millions of transactions. Zero real-time visibility.
A rapidly scaling gift card and commerce business managed millions of daily transactions across suppliers, inventory systems, customer redemption platforms, and financial operations. Leadership relied on manually generated reports from different departments. By the time insights reached decision-makers, the window to act had already closed — on fraud, on stock risk, on supplier failures.
A live intelligence platform — not another reporting layer
OpsTree consolidated data across all operational and financial systems into a single, real-time observability platform — with predictive capabilities for inventory, fraud, and supplier risk.
- ✓ Executive dashboards delivering live supplier performance, inventory movement, redemption trends, and transaction activity
- ✓ Predictive insights for demand forecasting, supplier float management, and fraud risk — acting before issues impacted customers
- ✓ Automated intelligence that eliminated the manual reporting pipeline entirely
- ✓ Greater executive confidence with one source of truth across all departments
Questions enterprises ask before building their data platform
Real answers — not marketing copy.
Our engineering team is here to help. Browse our documentation or get in touch to discuss your specific situation.
Explore More OpsTree Business Solutions
Revenue & Customer Intelligence is one layer of OpsTree's connected intelligence stack.
Your data already knows where the gaps are. Let's surface them.
We'll show you exactly what a unified data platform looks like running on your source systems — with live leakage detection, Customer 360, and self-service dashboards built for your business.