Prometheus-Alertmanager integration with MS-teams

As we know monitoring our infrastructure is one of the critical components of infrastructure management, which ensures the proper functioning of our applications and infrastructure. But it is of no use if we are not getting notifications for alarms and threats in our system. As a better practice, if we enable all of the notifications in a common work-space, it would be very helpful for our team to track the status and performance of our infrastructure.

Last week, all of a sudden my company chose to migrate from slack to MS-teams as a common chatroom. Which meant, now, notifications would also be configured to MS-teams. If you had search a bit, you will find that there isn’t any direct configuration for Ms-teams in alert manager as slack does. As a DevOps engineer I didn’t stop and looked beyond for more solutions and I found out that we need some proxy in between ALERTMANAGER and MS-teams for forwarding alerts and I proceeded to configure those.

There are a couple of tools, which we can use as a proxy, but I preferred to use prometheus-msteams, for a couple of reasons.

  • Well-structured documentation.
  • Easy to configure.
  • We have more control in hand, can customise alert notification and you can also configure to send notifications to multiple channels on MS-teams. Besides well-described documentation.
    I still faced some challenges and took half of the day of mine.

How it works?

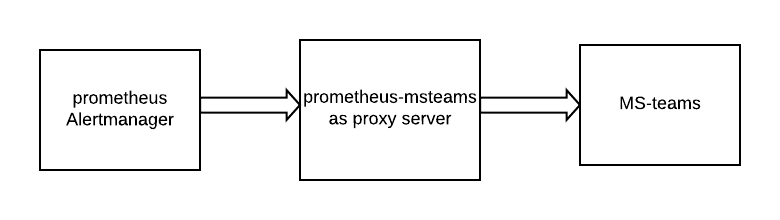
Firstly, Prometheus sends an alert to ALERTMANAGER on basis of rules we configured in the Prometheus server. For instance, if memory usages of the server are more than 90%, it will generate an alert, and this alert will send to ALERTMANAGER by the Prometheus server. Afterward, ALERTMANGER will send this alert to prometheus-msteams which in turn send this alert in JSON format to MS-teams’s channel.

How to Run and Configure prometheus-msteams

We have multiple options to run prometheus-msteams

  1. Running on standalone Server (Using Binary)
  2. Running as a Docker Container

Running on Server

Firstly, you need to download the binary, click here to download the binary from the latest releases.

When you execute the binary with help on your system, you can see multiple options with description, which help us to run prometheus-msteams just like man-pages.

prometheus-msteams --help

you can run promethues-msteams service as follow.

./prometheus-msteams server \
    -l localhost \
    -p 2000 \
    -w "Webhook of MS-teams channel"

Above options explanation

  • -l: On which address prometheus-msteams going to listen, the default address is “0.0.0.0”. In the above example, prometheus-msteams listening on the localhost.
  • -p: On which port prometheus-msteams going to listen, the default port is 2000
  • -w: The incoming webhook of MS-teams channel we are going to insert here.

Now you know how to run prometheus-msteams on the server, let’s configure it with ALERTMANAGER.

Step 1 (Creating Incoming Webhook)

Create a channel in Ms-teams where you want to send alerts. Click on connectors(found connectors in options of the channel), and then search for ‘incoming webhook’ connector, from where you can create a webhook of this channel. Incoming webhook is used to send notification from external services to track the activities.

Step 2 (Run prometheus-msteams)

Till now, you have an incoming webhook of a channel where you want to send the notification. After that, you need to setup prometheus-msteams, and run it.

To have more options in the future you can use config.yml to provide webhook. So that you can give multiple webhooks to send alerts to multiple channels in MS-teams in future if you need it.

$ sudo nano /opt/promethues-msteams/config.yml

Add webhooks as shown below. if you want to add another webhook, you can add right after first webhook.

connectors:
  - alert_channel: "WEBHOOK URL"

The next step is to add a template for custom notification.

$ sudo nano /opt/prometheus-msteams/card.tmpl

Copy the following content in your file, or you can modify the following template as per your requirements. This template can be customized and uses the Go Templating Engine.

{{ define "teams.card" }}
{
  "@type": "MessageCard",
  "@context": "http://schema.org/extensions",
  "themeColor": "{{- if eq .Status "resolved" -}}2DC72D
                 {{- else if eq .Status "firing" -}}
                    {{- if eq .CommonLabels.severity "critical" -}}8C1A1A
                    {{- else if eq .CommonLabels.severity "warning" -}}FFA500
                    {{- else -}}808080{{- end -}}
                 {{- else -}}808080{{- end -}}",
  "summary": "Prometheus Alerts",
  "title": "Prometheus Alert ({{ .Status }})",
  "sections": [ {{$externalUrl := .ExternalURL}}
  {{- range $index, $alert := .Alerts }}{{- if $index }},{{- end }}
    { 
      "facts": [
        {{- range $key, $value := $alert.Annotations }}
        {
          "name": "{{ reReplaceAll "_" "\\\\_" $key }}",
          "value": "{{ reReplaceAll "_" "\\\\_" $value }}"
        },
        {{- end -}}
        {{$c := counter}}{{ range $key, $value := $alert.Labels }}{{if call $c}},{{ end }}
        {
          "name": "{{ reReplaceAll "_" "\\\\_" $key }}",
          "value": "{{ reReplaceAll "_" "\\\\_" $value }}"
        }
        {{- end }}
      ],
      "markdown": true
    }
    {{- end }}
  ]
}
{{ end }}

Create prometheus-msteams user, and use --no-create-home and --shell /bin/false to restrict this user log into the server.

$ sudo useradd --no-create-home --shell /bin/false prometheus-msteams

Now, set the user and group ownership on the prometheus-msteams directorie, and prometheus-msteams binary to the prometheus-msteams user.

Create a service file to run prometheus-msteams as service with the following command.

$ sudo nano /etc/systemd/system/prometheus-msteams.service

The service file tells systemd to run prometheus-msteams as the prometheus-msteams user, with the configuration file located /opt/promethues-msteams/config.yml, and template file located in the same directory.

Copy the following content into prometheus-msteams.service file.

[Unit]
Description=Prometheus-msteams
Wants=network-online.target
After=network-online.target

[Service]
User=prometheus-msteams
Group=prometheus-msteams
Type=simple
ExecStart=/usr/local/bin/prometheus-msteams -config-file /opt/prometheus-msteams/config.yml -template-file /opt/prometheus-msteams/card.tmpl

[Install]
WantedBy=multi-user.target

promethues-msteams listen on localhost on 2000 port, and you have to provide configuration file and template also.

To use the newly created service, reload systemd.

$ sudo systemctl daemon-reload

Now Start promethues-msteams.

$ sudo systemctl start prometheus-msteams.service

Check, whether the service is running or not.

$ sudo systemctl status prometheus-msteams

Lastly, enable the service to start on the boot.

$ sudo systemctl enable prometheus-msteams

Now, prometheus-msteams is up and running, we can configure ALERTMANAGER to send alerts to prometheus-msteams.

Step 3(Configure ALERTMANAGER)

Open alertmanager.yml file in your favorite editor.

$ sudo vim /etc/alertmanager/alertmanager.yml

you can configure ALERTMANAGER as shown below.

global:
  resolve_timeout: 5m

templates:
  - '/etc/alertmanager/*.tmpl'

receivers:
- name: alert_channel
  webhook_configs:
  - url: 'http://localhost:2000/alert_channel'
    send_resolved: true

route:
  group_by: ['critical','severity']
  group_interval: 5m
  group_wait: 30s
  receiver: alert_channel
  repeat_interval: 3h

In the above configuration, ALERTMANAGER is sending alerts to prometheus-msteams, which is listening on localhost, and we pass send_resolved, which will send resolved alerts.

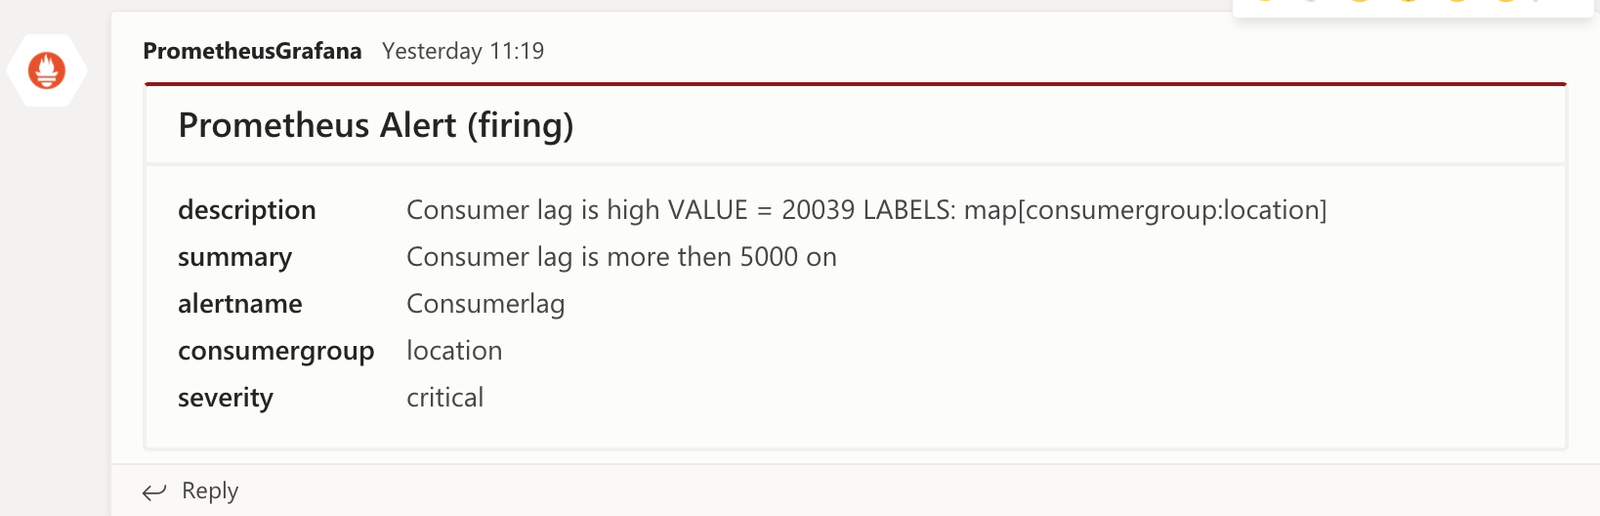
The critical alert to MS-teams will look like below.

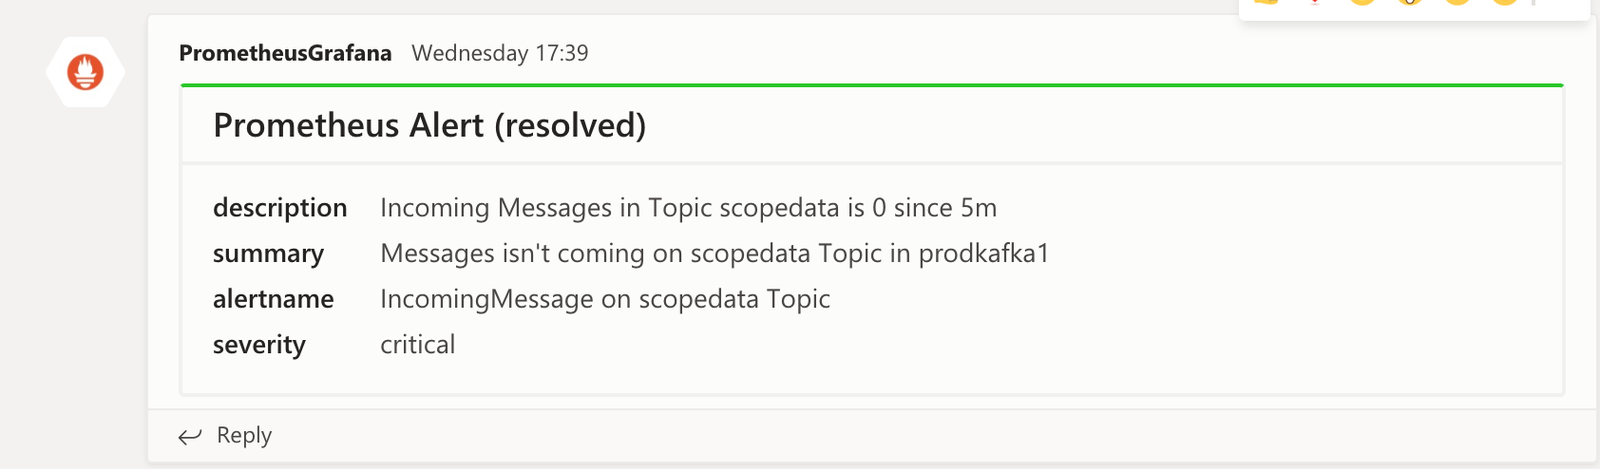
When alert resolved, it will look like below.

Note: The logs of prometheus-msteams created in /var/log/syslog file. In this file you will find every notification send by prometheus-msteams. Apart from this, if something went wrong, and you are not getting notification, you can debug in syslog file

As Docker Container

you can also run prometheus-msteams as container in your system. All configuration files of prometheus-msteams going to be the same, you just need to run the following command.

docker run -d -p 2000:2000 \
    --name="promteams"  \
    -v /opt/prometheus-msteams/config.yml:/tmp/config.yml \
    -e CONFIG_FILE="/tmp/config.yml" \
    -v /opt/prometheus-msteams/card.tmpl:/tmp/card.tmpl \
    -e TEMPLATE_FILE="/tmp/card.tmpl" \
    docker.io/bzon/prometheus-msteams:v1.1.4

Now that you are all set to get alerts in MS-teams channel, you can see that it isn’t as difficult as you originally thought. Ofcourse, this is not the only way to get alerts on MS-teams. You can always use different tool like prome2teams, etc. With this, I think we are ready to move ahead and explore other monitoring tools as well.

I hope this blog post explains everything clearly. I would really appreciate to get feedback in comments.

27 thoughts on “Prometheus-Alertmanager integration with MS-teams”

  1. Hey thanks for the post, however i’m struggling to get notifications in msteams. I set up everything in a Docker-Container (v1.1.4) just like you described, my alert is firing and the alertmanager shows it but nothing shows up in msteams. /var/log is empty in my container. Do you have any idea what might be the reason? 🙂

    1. Hi @ragemoody, You have to make sure that your alertmanager is sending alerts to prometheus-msteams firslty, for that you can check alertmanager.yml file, and add prometheus-msteams info in this file as mentioned. Afterwards prometheus-msteams will print logs on /var/log/syslog once it gets alerts from alertmanager

  2. Thanks for the clear blog. I had a lot of trouble figuring out why it would not work on my server though so I wanted to share that I had to update the prometheus-msteams commandline args as follows to get it to work with alertmanager:
    ExecStart=/usr/local/bin/prometheus-msteams \
    -template-file “/opt/prometheus-msteams/card.tmpl” \
    -config-file “/opt/prometheus-msteams/config.yml”
    Regards,
    Lisa.

  3. Hi,
    when i specify the card.tmpl file in the alertmanager.yml file and restart the service, I get this error message: component = configuration msg = “one or more config change subscribers failed to apply new config”
    file = /opt/prometheus/alertmanager/alertmanager.yml err = “failed to parse template: card.tmpl: 36: function \” counter \ “not defined”
    Do you have any ideas why this could be?
    alertmanager version: 0.21.0
    prometheus-msteams version: v1.4.1

  4. Hi,
    when i specify the card.tmpl file in the alertmanager.yml file and restart the service, I get this error message: component = configuration msg = “one or more config change subscribers failed to apply new config”
    file = /opt/prometheus/alertmanager/alertmanager.yml err = “failed to parse template: card.tmpl: 36: function \” counter \ “not defined”
    Do you have any ideas why this could be?
    alertmanager version: 0.21.0
    prometheus-msteams version: v1.4.1

    1. Hi baloghszilveszter,
      With the following command, you can run prometheus-msteams service, and then you can add URL of this service in under webhook_configs in alertmanger.yml
      /usr/local/bin/prometheus-msteams -config-file /opt/prometheus-msteams/config.yml -template-file /opt/prometheus-msteams/card.tmpl
      As in the above command, card.tmpl pass with promtheus-msteams binary as of template for ms-teams notification. You can refer to prometheus-msteams.service, and alertmanger.yml file for setup.

      1. Hi,
        Thank you for your response. The problem was that the templates remained in alertmanager.yml. I commented on this, after that the service started correctly.
        The MS Temas channel is already receiving messages. 🙂

  5. Hi, thanks for great guide.

    I already have a prometheus-alertmanager working just fine with a Slack integration. Do you have any suggestion on how I can incorporate this guide, so I can integrate with both msteams and Slack with the same alerting rules, I already have defined?

    Thanks in advance 🙂

  6. Having setup as instructed above I get the following error:
    msg=”Notify attempt failed, will retry later” attepts=1 err=”Post \”http://127.0.0.1:5001/\”: dial tcp 127.0.0.1:5001: connect: connection refused”

    1. Hi Jon,

      It would be helpful to solve above issue if you can share your configuration file of promethues-msteams, and alertmanger.

      1. Hi.

        The config file has the following (I’ve replace the actual webhook url with the below):
        connectors:
        – alert_channel: “webhoo url”

        And the alertmanager config :
        global:
        resolve_timeout: 5m

        templates:
        – ‘/etc/alertmanager/card.tmpl’

        receivers:
        – name: alert_channel
        webhook_configs:
        – url: ‘http://192.168.23.176:2000/alert_channel’
        send_resolved: true

        route:
        group_by: [‘critical’,’severity’]
        group_interval: 5m
        group_wait: 30s
        receiver: alert_channel
        repeat_interval: 3h

  7. I can’t start the service prometheus-msteams , follow:
    [Unit]
    Description=Prometheus-msteams
    Wants=network-online.target
    After=network-online.target

    [Service]
    User=prometheus-msteams
    Group=prometheus-msteams
    Type=simple
    ExecStart=/usr/local/bin/prometheus-msteams -config-file /opt/prometheus-msteams/config.yml -template-file /opt/prometheus-msteams/card.tmpl

    [Install]
    WantedBy=multi-user.target

    can you help me?
    The error: Loaded: loaded (/etc/systemd/system/prometheus-msteams.service; disabled; vendor preset: disabled)
    Active: failed (Result: exit-code) since Wed 2021-06-02 22:17:26 +07; 6s ago
    Process: 8641 ExecStart=/usr/local/bin/prometheus-msteams -config-file /opt/prometheus-msteams/config.yml -template-file /opt/prometheus-msteams/card.tmpl (code=exited, status=203/EXEC)
    Main PID: 8641 (code=exited, status=203/EXEC)

    1. Hi kukuxima,
      Have you reloaded the prometheus-msteams.service with the following command
      sudo systemctl daemon-reload
      Then please enable the service with the following command
      sudo systemctl enable prometheus-msteams

  8. Dear Sir. i used prometheus-msteams with http proxy internal, i can’t send data to msteams channel. please help me. Thanks

  9. -l: On which address prometheus-msteams going to listen, the default address is “0.0.0.0”. In the above example, prometheus-msteams listening on the localhost.

    —>” 0.0.0.0″ is a direct internet, how to config prometheus-msteams going to listen the proxy server.
    P/s: the proxy server running on another host

    Thanks sir

    1. We are using localhost because both prometheus-msteams and Alertmanager are running on the same host
      You can run both different server, you just need to update the alertmanger.yaml configuration, where you have to replace the IP Address or DNS of the server where your prometheus-msteams is running.

      1. You can change the Listen Address of prometheus-msteams by providing following option
        -http-addr string
        HTTP listen address. (default “:2000”)

  10. Discomfort, which I’m facing with this connector is, that firing alerts are mixed with resolved in single MS teams message, so I can not distinguish, which alerts are firing and which are resolved.
    I assume, that I can improve this by modification of card.tmpl. Do you have any experience with it or perhaps you already have improved template?

    1. Krzysztof Taborski
      In Following example, in title, I am using Status as a variable, which can be either firing or resolved. Resolved alert only triggers if you enable this in alertmanager.yaml config file like I did in the above example.
      “title”: “Prometheus Alert ({{ .Status }})”,

      In the following example, we are changing the color when the alert got resolved, like this you can add any color with firing as well.
      “themeColor”: “{{- if eq .Status “resolved” -}}2DC72D
      {{- else if eq .Status “firing” -}}

      1. Yes, and it works pretty well only when single alert is firing, but considering scenario:
        1. alert1 is firing -> message is posted (Prometheus Alert (Firing))
        2. alert2 is firing, alert1 is still firing -> message is posted with info, that alert1 and alert2 is firing (Prometheus Alert (Firing))
        3. alert1 is resolved, but alert2 is still firing -> message is posted (Prometheus Alert (Firing))

        In last message (alert1 is resolved, but alert2 is still firing) it is hard to distinguish, that alert1 is resolved. It looks very similar to message from point 2nd.

      2. In case of single alert everything works perfectly, however considering scenario:
        1. alert1 is firing -> alert is send to MS teams with alert1 firing
        2. after that, alert2 is firing -> alert is sent to MS teams with alert1 and alert2 firing
        3. alert1 is resolved -> alert is sent to MS teams with alert1 resolved and alert2 still firing

        In 3rd message it’s hard to distinguish, that alert1 is resolved, alert2 is still firing.
        Title is still “Prometheus Alert (Firing)”. The only change is, that message is with gray color, but it is not possible to check, which alert is firing and which is resolved.

  11. Hi Mahesh, I am configure Prometheus, Alert Manager and Grafana but my concern is i am not able to integrate alert manager to MS teams , I need your help.

    1. Hi Kalander, you can follow the above blog to integrate alert managers with MS teams. Let me know if you are facing an issue in above steps

      1. Sure , I will try to configure AlertManager to MS Teams integration which is you provide above blog if i am facing any issue i will catch you , Thanks in advance for support.

  12. Hi, Mahesh! Thank you for the blog.

    I am having trouble setting up this integration. I am using kube-promtheus-stack with blackbox-exporter and prometheus-msteams helm and I want my alerts to be shown on msteam channel.

    My alertmanager-teams.yaml look likes this:
    global:
    resolve_timeout: 15m
    receivers:
    – name: devnull
    – name: prometheus-msteams-critical
    webhook_configs:
    – url: “http://prometheus-msteams:2000/alertmanager-critical”
    – name: prometheus-msteams-warning
    webhook_configs:
    – url: “http://prometheus-msteams:2000/alertmanager-warning”
    route:
    group_by: [‘…’]
    group_interval: 5m
    group_wait: 5m
    repeat_interval: 7m
    receiver: devnull
    routes:
    – receiver: prometheus-msteams-critical
    match:
    severity: critical
    continue: true
    – receiver: prometheus-msteams-warning
    match:
    severity: warning

    When I describe my msteams pod I got “Readiness probe failed: Get “http://10.244.1.95:2000/config”: dial tcp 10.244.1.95:2000: connect: connection refused”

    And my msteams pod log says: “{“caller”:”transport.go:43″,”level”:”debug”,”request_path_added”:”/_dynamicwebhook/*”,”ts”:”2022-01-03T11:09:24.277838278Z”}
    {“branch”:”HEAD”,”build_date”:”2021-05-02T12:17:32+0000″,”caller”:”main.go:364″,”commit”:”3bdd0e3″,”listen_http_addr”:”:2000″,”ts”:”2022-01-03T11:09:24.377828511Z”,”version”:”v1.5.0″}”

    All my helm charts are running on Azure AKS. Also this same setup is working on my minikube locally. It would be a huge help. Thank You!

    1. “Readiness probe failed: Get “http://10.244.1.95:2000/config”: dial tcp 10.244.1.95:2000: connect: connection refused” – the pod is probably getting killed by OOM. The default resource limits are tiny in the deployment spec. Tested the install on minikube and had same issue i.e. readiness/liveness probs would fail. Upping the cpu and memory resource limits in deployment spec fixed the issue.

  13. Hi, I have followed the same procedure: Running on a server
    I am not able to receive notifications to my Teams Channel.

    I defined service file like this: ExecStart=/usr/local/bin/prometheus-msteams -config-file /opt/promethues-msteams/config.yml -template-file /opt/promethues-msteams/card.tmpl

    getting the below error:{“caller”:”logging.go:25″,”err”:null,”level”:”debug”,”response_message”:”Webhook message delivery failed with error: Microsoft Teams endpoint returned HTTP error 404 with ContextId tcid=0,server=msgapi-production-cse-azsc7-5-98,cv=JlKzRoE5+EirdzAVjXo1oA.0,MS-CV=JlKzRoE5+EirdzAVjXo1oA.0..”,”response_status”:200

    kindly help me

Leave a Reply