Elasticsearch is a scalable, full-text search and analytics engine based on Apache Lucene. It is Java-based and allows you to store, search, and analyze big volumes of data quickly in near real-time. It can search and index the document files in diverse formats. Lucene is the underlying technology that Elasticsearch uses for extremely fast data retrieval.
As flexible, scalable, and useful as Elasticsearch is, monitoring your cluster can help you ensure that the cluster is appropriately sized and handles all operations efficiently.
The Elastic Stack monitoring features provide a way to keep a pulse on the health and performance of your Elasticsearch cluster.
Elasticsearch consists of many components that had better be monitored.
ThreadPool, Operation Times, Operation stats, Documents, Segments, Shards, CPU, Index, Memory, Disk, Network, JVM Garbage Collector, and many more …
Prerequisites
Prometheus Operator
Elasticsearch Cluster
Grafana
Helm v3.2.4
Setup ElasticSearch Exporter
The purpose of exporters is to fetch metrics from Elasticsearch Stack and make those metrics available on the HTTP endpoint so that Prometheus serviceMonitor can pull metrics from that endpoint.
Step 1: Set the default namespace to your-elastic-search-namespace:
kubectl config set-context <your-kubernetes-cluster-name> --namespace=<your-elasticsearch-cluster-namespace>Step 2: Create Elasticsearch Exporter deployment using:
helm install elasticsearch-exporter --set es.uri=http://elasticsearch-node:9200 stable/elasticsearch-exporterWe can check the exporter pod and service created by helm:
kubectl describe pods $(kubectl get pods -lapp=elasticsearch-exporter -o=jsonpath='{.items[0].metadata.name}')kubectl describe svc elasticsearch-exporterCheck exporter exposing metrics or not
Login into any pod and made a curl request to exporter http endpoint:
kubectl exec -it elasticsearch-data-0 -c elasticsearch /bin/bash curl http://<exporter-pod-ip>:9108/metrics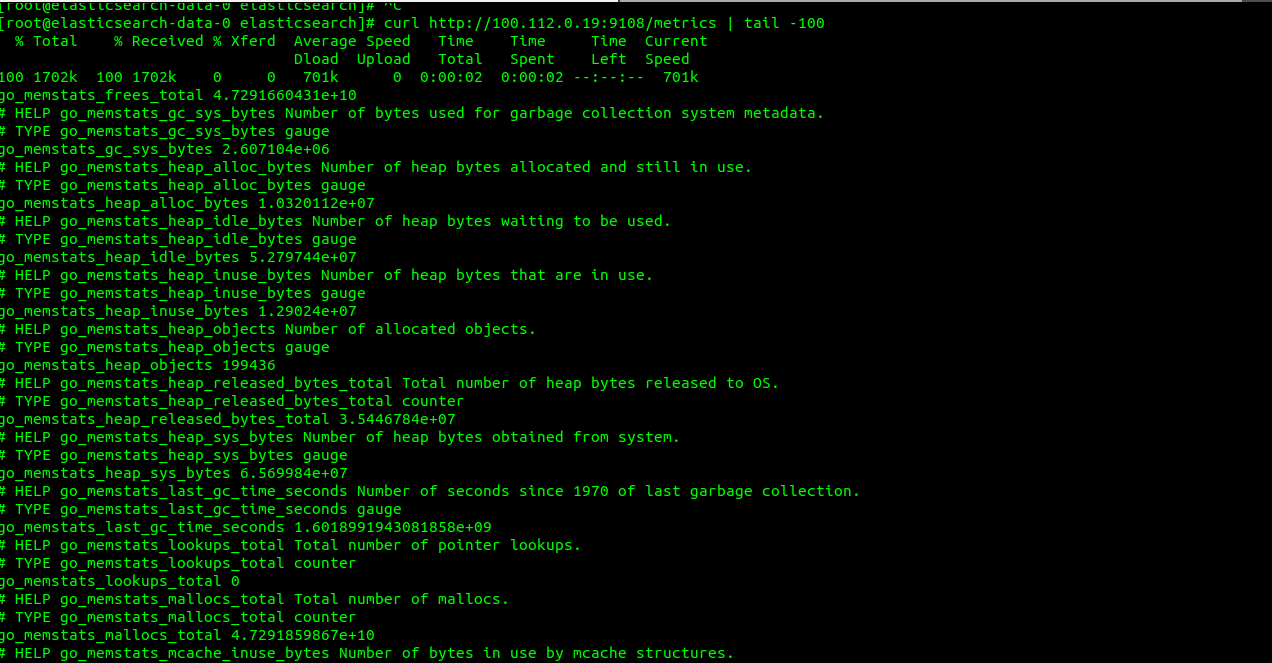
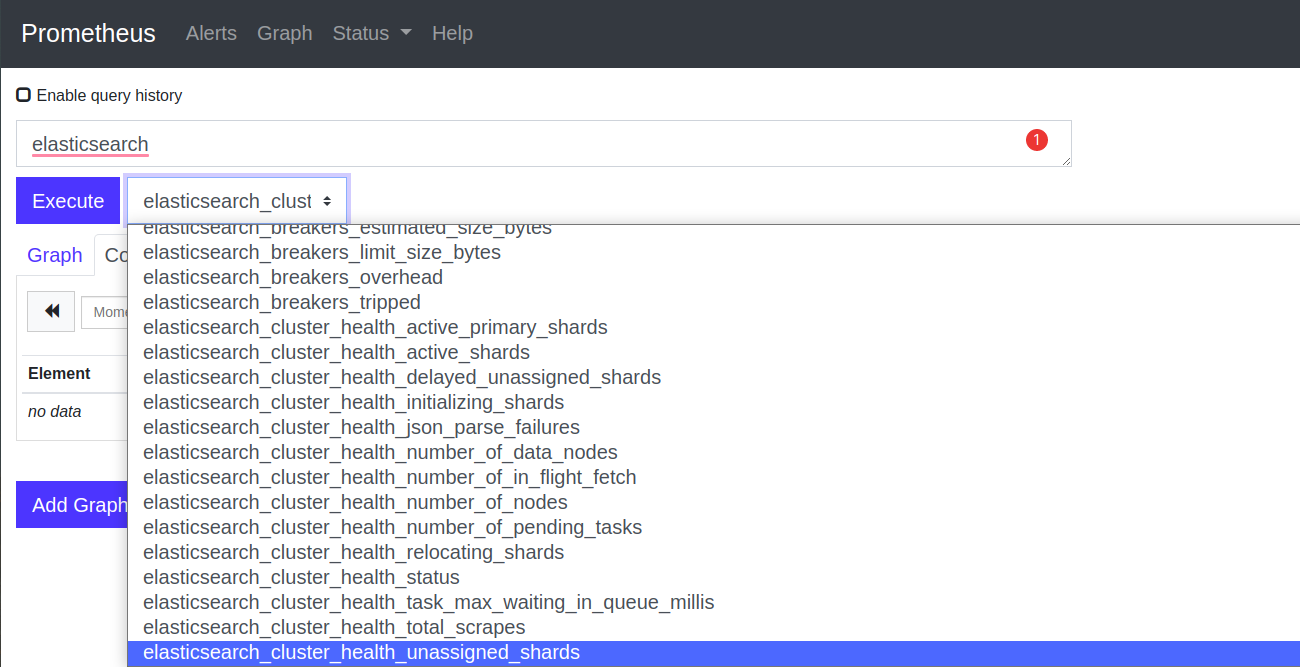
Or you can check metrics in Prometheus as shown below:
Setup Prometheus Operator’s ServiceMonitor
We create Prometheus operator’s serviceMonitor which point to elasticsearch exporter’s service:
apiVersion: monitoring.coreos.com/v1
kind: ServiceMonitor
metadata:
  labels:
    prometheus: k8s
  name: elastic-cluster
  namespace: monitoring
spec:
  selector:
    matchLabels:
      app: elasticsearch-exporter
      chart: elasticsearch-exporter-3.0.0
  namespaceSelector:
    matchNames:
    - elastc-cluster
  endpoints:
  - interval: 15s
    port: http
    scheme: http
After creating serviceMonitor, we can check metrics in Prometheus:
So we have successfully export elasticsearch cluster metrics to Prometheus. Now we use these metrics to create grafana dashboards
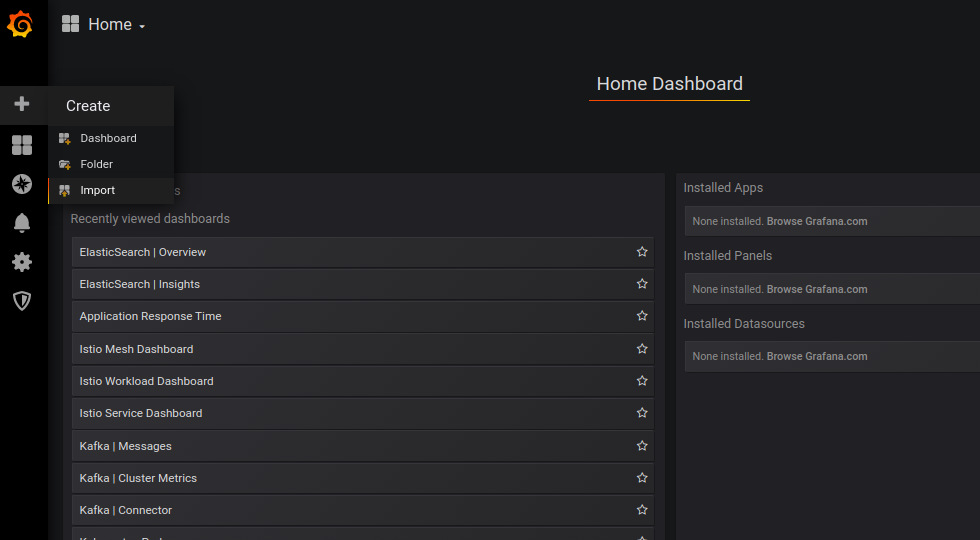
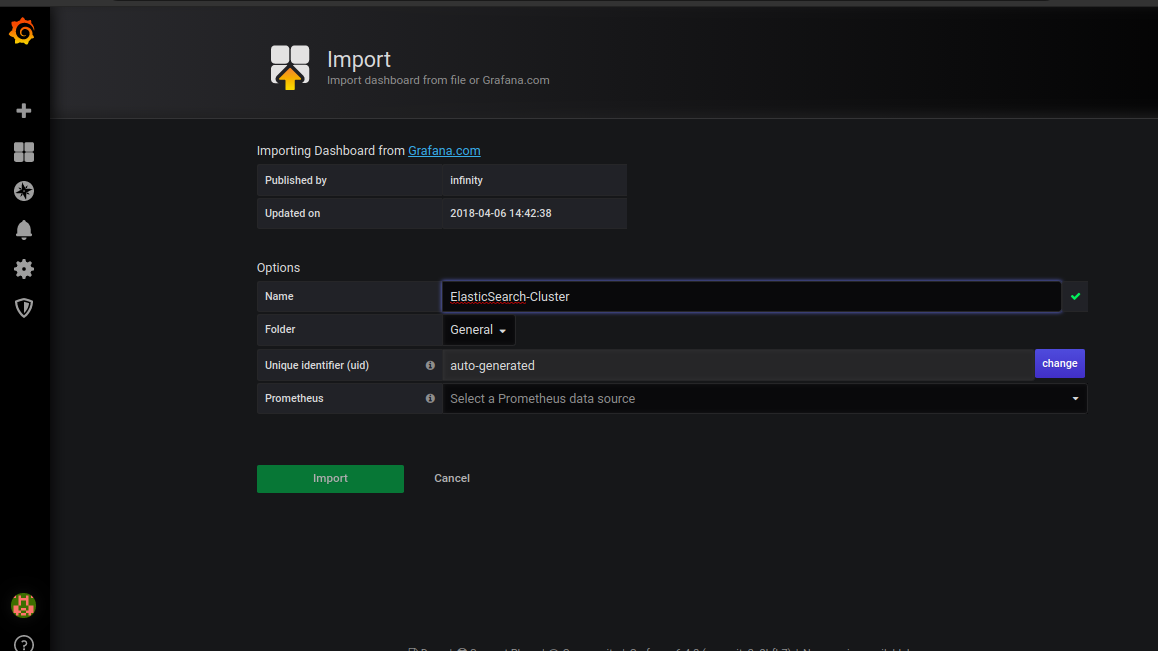
Generate grafana dashboard
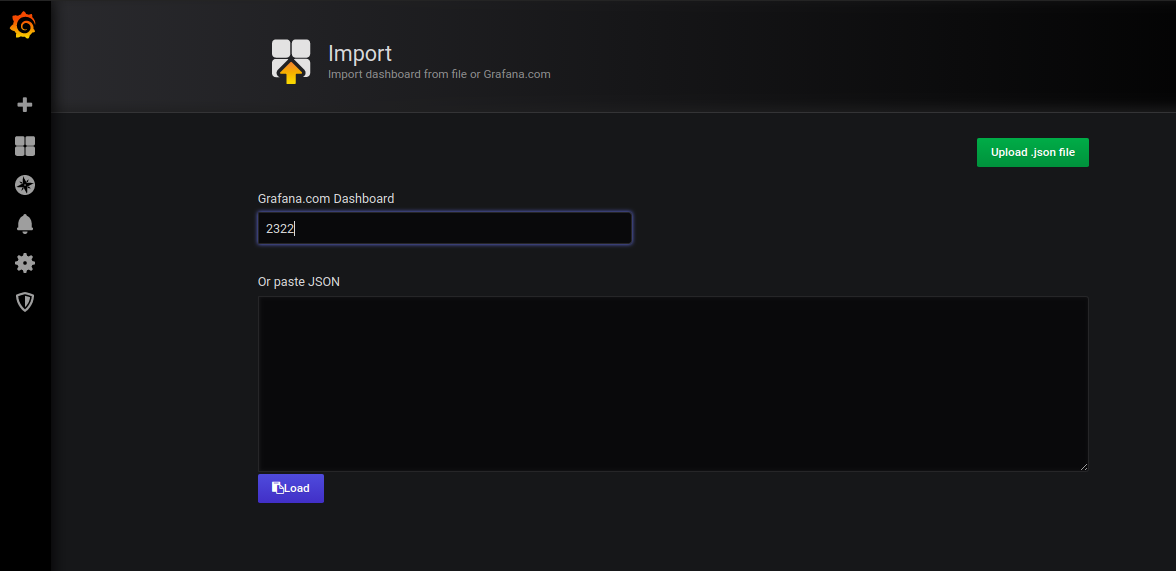
Go to Create->Import
Use Elasticsearch’s Grafana Dashboard
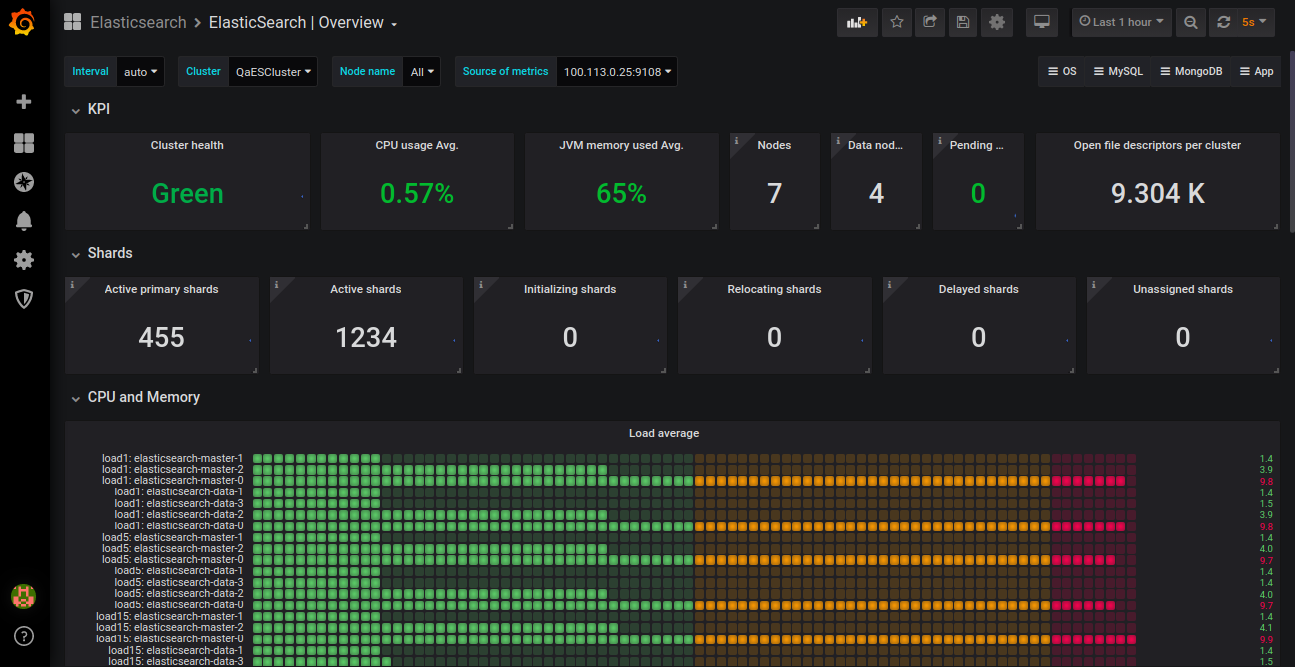

We can further set up alerting based on the query used to plot data on Grafana and integrate it with Alert Manager and further to the supported notification channels.
References:
https://github.com/helm/charts/tree/master/stable/elasticsearch-exporter
https://grafana.com/grafana/dashboards/2322
Opstree is an End to End DevOps solution provider