We have seen many security incidents. Any breach in security cause concern among enterprises. To be honest it not only concern them, it also gives birth to their nightmare, distrust and scepticism as organisation. The root cause of this distrust is improper implementation and configuration.
Opstree Security has started a new initiative where we rigorously analyse and implement CIS Benchmark of every tools being used today.
In this CIS series, we will discuss the CIS Benchmarks of PostgreSQL.
PostgreSQL
For those who are new to PostgreSQL . Let us give you a quick summary of it.
PostgreSQL is an open-source and free relational database management system (RDBMS). It was initially launched in July 1986 and so far in three decades, it has incorporated various key features that distinguish it from other ruling RDBMS.
It provides us various key benefits.
- Table inheritance
- User-defined types
- Nested transactions (savepoints)
- Multi-version concurrency control (MVCC)
FACTS
| Instagram uses two back-end database systems mainly. These are: PostgreSQL and Cassandra. Many organisations are using it.:- Apple Skype Spotify IMDB |
Objective
If you are using it in production , then this blog is specially written for you.
As PostgreSQL CIS Benchmark is vast topic to cover so we have segregated topics. In this blog we will endorse following PostgreSQL CIS Benchmarks.
- PostgreSQL Logging
- Directory and File Permission
PostgreSQL Logging
Most of the Postgres CIS checks are from logging. So most of our discussion will focus on important checks from it.
Ensure the log file destination directory is set correctly
show logging_collector;

If it yields something like log then it is not set and syslog is mainly handling logs and creating a directory /var/log/postgresql.
It is required for logging_collector to be enabled.
Let’s see logs.
We know how much crucial a log is as it tells us various information that has happened in our PostgreSQL.
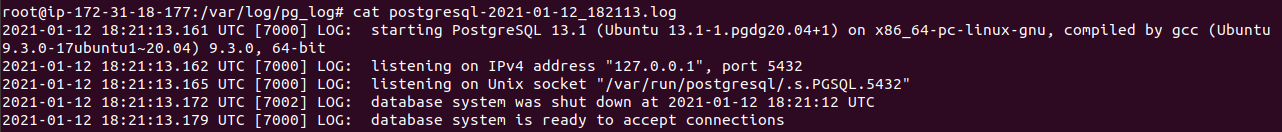
Here as you can see it shows us the Start and Stop time of PostgreSQL.
Let’s execute an error statement.
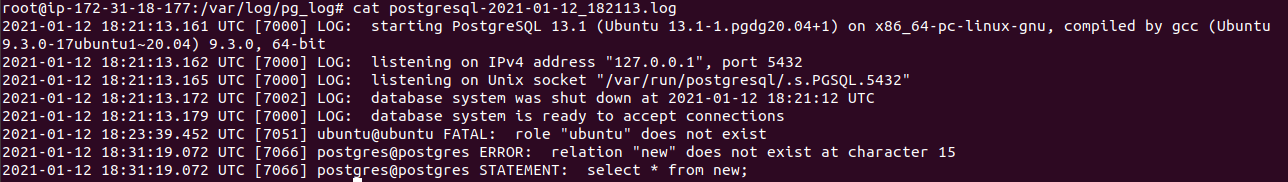
Now we are at least familiar with Postgres logging. Now let’s add some other checks.
[Also Read: The Ultimate Guide to Postgres MCP for Claude Desktop ]
Ensure ‘log_connections’ is enabled
By default, log_connections is not enabled.
When we enable it, it causes each attempted connection to the Postgres server to be logged, as well as successful completion of client authentication.
It helps us in auditing as well as when any breach has happened it quickly helps us to find source user and navigate us to quickly confine the breach to limited extent.
show log_connections ;

See what actually get logs.
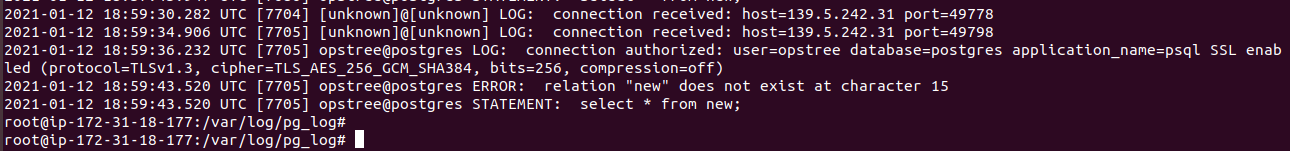
Here as you can see, I have remotely tried to connect my Postgres server. My Public IP has been captured. And you can see ‘opstree@postgres’ says command executed by opstree user in Postgres database. My public IP is also captured 139.5.242.31.
Ensure ‘log_disconnections’ is enabled
By default, log_disconnections is not enabled.
By enabling log_disconnections, it logs the end of each session, including session duration. By enabling the log_disconnections, one can view and examine connections for failed attempts and the duration of the logged-in session.
show log_disconnections ;

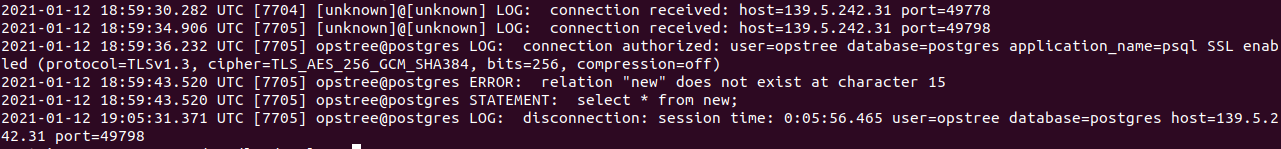
Look closely at the last line of Figure 7. You will see session time being recorded which in my case is 05 minutes 56 seconds. My Public IP, Database I have accessed, and user name.

Here you will show it also logs Authentication Failed for user opstree. These logs are very crucial.
We can collect these metrics and send to elasticsearch or any other monitoring tool too for internal purpose.
Ensure the log file permissions are set correctly
Log File Permission is mandatory to be set to 0600. Any loose permission will allow other users to read it. As shown earlier, logs contain crucial information. So its file permission must be restricted.
Execute Following psql statement to check:
show log_file_mode;


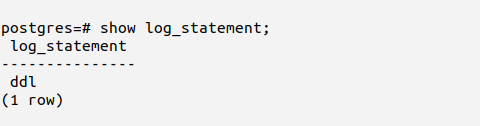
Ensure ‘log_statement’ is set correctly
log_statement setting specifies the types of SQL statements that are logged.
By default, it is set to none. And if so this is a fail.
If someone created a table, altered it, or dropped it, these actions will not be logged. As per CIS, this should be set to ddl.
Other Values are:
- none (off)
- ddl (logs all data definition statements: )
- mod (logs all ddl statements, plus data-modifying statements like insert, update )
- all (logs all statement) can be noisy
show log_statement;
Let’s create a table and then delete it and see if it is logged or not.

Here we have important statements that are being logged along with user-details.
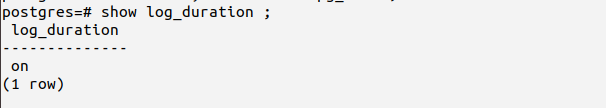
Ensure ‘log_duration’ is enabled
Enabling the log_duration setting causes the duration of each completed SQL statement to be logged.
By logging the duration of statements, it becomes easier to identify both non-performant queries as well as possible DoS attempts (excessively long-running queries)
By default, it is set to off.
show log_duration;
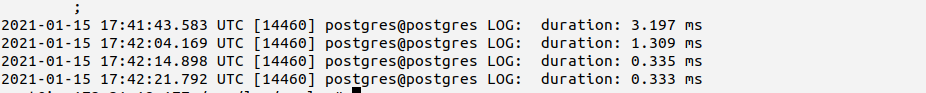
Now it prints user and database the duration belongs to. But doesn’t print statement.
Because logging of SQL statements may include sensitive information of your customer or organization that should not be recorded in logs. Doing so will also create an overhead or great noise level.
Example:- All statements that I have executed are working well and the responses in ms (millisecond ) are good too. It is just done to check the performance of our queries when required. These parameters are generally exported to elasticsearch or any monitoring tool and there we analyze the performance.
Ensure ‘log_min_duration_statement’ is disabled
It specifies the minimum execution time for a statement at which the statement will be logged. For example, if you set it to 750 ms, then all SQL statements that execute in 750 ms or longer will be logged along with the statement. Setting it to -1 disables this feature, which is recommended.
By default, it is set to -1. i.e disabled.
We also want to say that you can enable this feature (while testing your queries in the development and staging environment) or in prod too if it is suitable for your organization, as scenarios are always different from one organization to another.
show log_min_duration_statement;
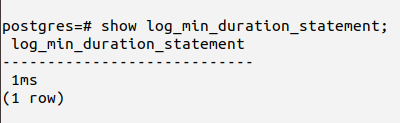
This is deliberately done to show you it’s use-case. By default, it is -1 (disabled) as recommended.
To show you an example of what it records, we are enabling this to 1 ms. So I will execute two statements one with less time and another with more time than 1 ms. This is just done to show you the outcome.

Here you can see statement taking 1 ms are recorded along with statement executed and others are exempted and their duration is logged only.
[ Also Read: AI for Smarter Data Integration ]
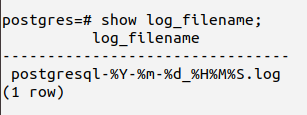
Ensure the filename pattern for log files is set correctly
Log rotation depends upon log_rotation_age or log_rotation_size and when they met, It creates a new file whose name depends upon the file name pattern
The default in many versions of Postgres is postgresql-%a.log , which creates a new log file for each day of the week (e.g. postgresql-Mon.log , postgresql-Tue.log ).
Thus it should be set to postgresql-%Y%m%d.log (recommend).
OR
postgresql-%Y-%m-%d_%H%M%S.log
show log_min_duration_statement;
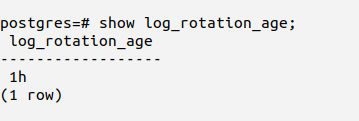
Ensure the maximum log file lifetime is set correctly
When logging_collector is enabled, the log_rotation_age parameter determines the maximum lifetime of an individual log file. Once maximum log file lifetime is met, automatic log file rotation will occur.
Default:- It is set to 1d
show log_rotation_age;
It should be set to 1 hour.
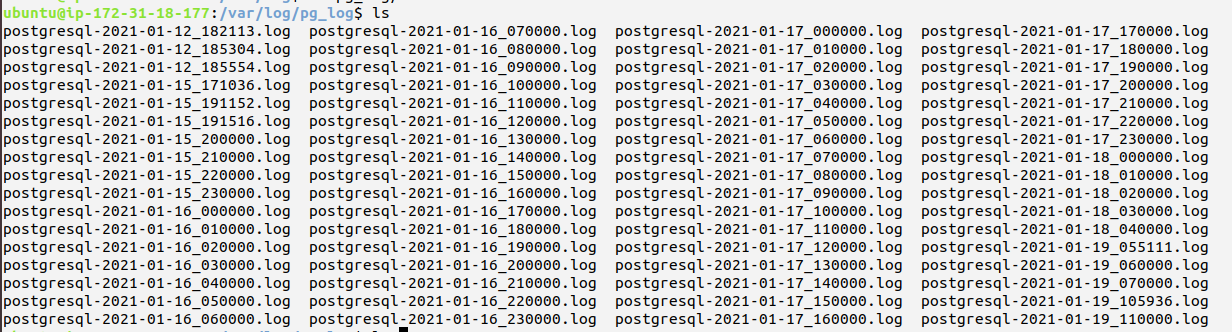
Let’s say Opstree bank is using Postgres. It generates a hefty amount of statements or queries by customer. If the rotation age is 1 day. Then we have a single log file for the entire day. It will be difficult for them to look for specific queries when required. Instead, what they will do they will want to rotate file hourly.
Instead of having one single file for the entire day. Now we have 12 hourly log files for the entire day.
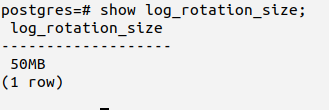
Ensure the maximum log file size is set correctly
The log_rotation_size setting determines the maximum size of an individual log file. Once the maximum size of the log file is reached, automatic log file rotation will occur.
Default: Based on Postgres versions it can vary differently.
Make sure it is not set to 0 which means disabled. This will prevent automatic log file rotation when files become too large.
It should be set to 1 GB as per CIS.
show log_rotation_age;
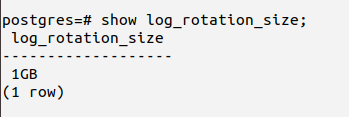
So if the file size is greater than the specified value it will create a new file.
To show you an example we have deliberately set log_rotation_size to 50 MB.
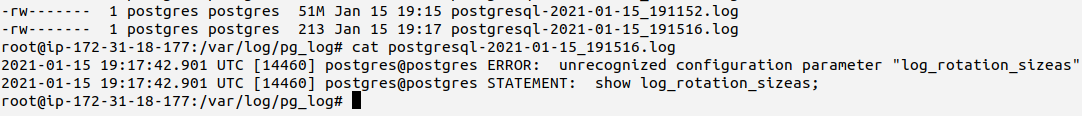
New logs are added into a new file as the previous file size has reached 50MB. And log rotation is triggered.
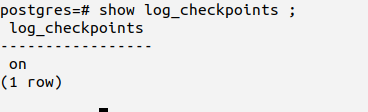
Ensure ‘log_checkpoints’ is enabled
A checkpoint is a point in the transaction log sequence wherein all the data files have been updated to reflect the information in the log.
When a crash happens, the latest checkpoint record is determined in the log from where it should start the REDO operation.
Default:- It is disabled or off.
show log_checkpoints ;
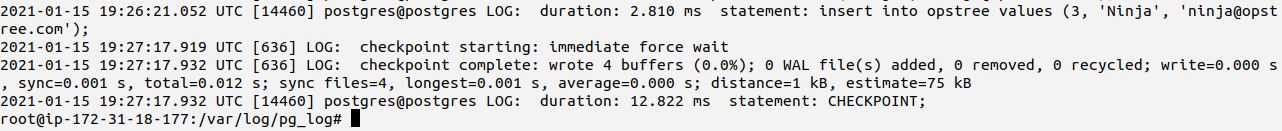
To show you I have executed a forced checkpoint to show you how checkpoint get logs
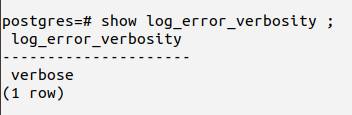
Ensure ‘log_error_verbosity’ is set correctly
It specifies the verbosity (amount of detail) to be logged of an error message.
When a statement is executed which eventually results in an error. This parameter specifies Postgres to log level of information along with error.
By default, it is set to default (log error statement).
show log_error_verbosity ;
Other values:
- TERSE:- It displays limited information like sql statement which generated error.
- VERBOSE:- It shows us error code, source file name, function name where it failed, and line number
It should be set to verbose as per CIS but organizations should discuss and set what will be better for their case.
I have executed an error statement.
show log_error_verbosityasd ;

What verbose level logs.

PostgreSQL Logging Quick Summary:-
| Check Name | Default Value | Recommended Value |
| ENSURE THE LOG FILE DESTINATION DIRECTORY IS SET CORRECTLY | Depend on version | Log Directory should be set. |
| Ensure ‘log_connections’ is enabled | off | on |
| Ensure ‘log_disconnections’ is enabled | off | on |
| Ensure the log file permissions are set correctly | 600 | 600 |
| Ensure ‘log_statement’ is set correctly | none | ddl |
| Ensure ‘log_duration’ is enabled | off | on |
| Ensure ‘log_min_duration_statement’ is disabled | -1 | -1 |
| Ensure the filename pattern for log files is set correctly | Depend upon Version |
postgresql-%Y%m%d.log or postgresql-%Y-%m-%d_%H%M%S.log |
| Ensure the maximum log file lifetime is set correctly | 1d | 1h |
| Ensure the maximum log file size is set correctly | Depend upon version | 1GB |
| Ensure ‘log_checkpoints’ is enabled | off | on |
| Ensure ‘log_error_verbosity’ is set correctly | default | verbose |
Directory and File Permission
Ensure the file permissions mask is correct
As we know when a file or directory is created, its permission depends upon the umask value. Therefore this umask value should be set to restrict group and other permission.
By default, it is 002.
It should be set to 077. Which will restrict groups and other users from read and write permissions.

Here as you can see Postgres dir has umask of 002. So when I created a file it allowed read permission to other users. Umask should be set to 077
Following checks are not included in the official CIS Benchmark (CIS PostgreSQL 9.5 Benchmark v1.1.0) but we want you to check it too.
- Restricted Permission of PostgreSQL Data Directory
- Restricted Permission of PostgreSQL Config Directory
- Restricted Permission of PostgreSQL Log Directory
Directory Permission Quick Summary:-
| Check Name | Default Value | Recommended |
| Ensure the file permissions mask is correct | 022 | 077 |
Conclusion
PostgreSQL is one of the top elite RDBMS and it is required to ensure that we are following the best security practices.
Here we have discussed PostgreSQL logging and directory permission.
We covered important checks, psql command to check it, its default value, and what the is recommendation.
We will have another blog in which we will cover
- Replication
- Network & Connectivity
Thanks for reading this blog. As we are still evaluating PostgreSQL security
Related Searches – Data engineering services provider | AWS Service Provider