Let’s say you are the DevOps lead for a large e-commerce platform that runs on a microservices architecture with hundreds of services. You need to monitor the logs of all these services to quickly identify issues, troubleshoot problems, and optimize the system’s performance. You also want to be able to search and analyze logs across all services in real time and be alerted when any critical issues arise.
To address this scenario, you could use Grafana Loki as your centralized logging system. Loki is a lightweight and cost-effective solution that can handle high volumes of logs and store them in a distributed manner. You can configure each service to send logs to Loki, which will automatically index them and make them available for search and analysis.
Introduction
Loki and Grafana are two open-source projects that are commonly used together for log aggregation, analysis, and visualization.
Loki is a horizontally-scalable, highly-available, multi-tenant log aggregation system inspired by Prometheus. It is designed to be a cost-effective solution for storing and querying logs and uses a unique indexing approach to provide fast and efficient searching of log data. Loki is also highly extensible, allowing users to easily add custom logging drivers and integrate with other systems.
Grafana, on the other hand, is a popular open-source platform for visualizing and analyzing time-series data, including logs. It provides a powerful and flexible dashboarding system that allows users to create customized visualizations and alerts based on their log data. Grafana also integrates with many different data sources, including Loki, which makes it a great choice for log analysis and visualization.
Why prefer Loki over other logging tools?
There are other logging tools available but Loki’s combination of scalability, cost-effectiveness, Prometheus integration, centralized log aggregation, powerful querying capabilities, log stream processing and community support make it a compelling choice for many organizations seeking an efficient and effective logging solution.
- Efficient scaling: Loki is highly scalable and able to handle massive volumes of log data efficiently thanks to its distributed architecture and compressed, indexed log storage.
- Cost-effectiveness: When compared to conventional log management solutions, Loki’s use of object storage—such as Amazon S3 or Google Cloud Storage—helps lower storage costs.
- Seamless integration with Prometheus: Loki integrates smoothly with Prometheus, allowing for correlation between logs and metrics. This correlation enhances troubleshooting and analysis capabilities.
- Centralized log aggregation and querying: Loki provides a centralized log aggregation solution, enabling logs from multiple sources to be collected and queried in a unified manner. Its powerful filtering and querying capabilities, inspired by Prometheus, make log analysis and troubleshooting more efficient.
- Log stream processing: Loki supports log stream processing, allowing for the extraction of labels and application of filters to logs. This enables actions such as routing logs to different destinations or creating alerting rules based on log content.
- Open-source and community-driven: As an open-source project with an active community, Loki benefits from a wide range of community-contributed integrations, enhancements, and support. This makes it a flexible and well-supported logging solution.
Loki Architecture

Installation
There are diff methods available to install Loki e.g. via helm, docker-compose, binary and etc
Choose the specific version from site Loki-Releases and run via below instructions.
While running binary we need to pass config-file. Please find an example of config file below
auth_enabled: false

server:
  http_listen_port: 3100

ingester:
  lifecycler:
    address: 127.0.0.1
    ring:
      kvstore:
        store: inmemory
      replication_factor: 1
    final_sleep: 0s
  chunk_idle_period: 5m
  chunk_retain_period: 30s
  max_transfer_retries: 0

schema_config:
  configs:
    - from: 2018-04-15
      store: boltdb
      object_store: filesystem
      schema: v11
      index:
        prefix: index_
        period: 168h

storage_config:
  boltdb:
    directory: /data/loki/index

  filesystem:
    directory: /data/loki/chunks

limits_config:
  enforce_metric_name: false
  reject_old_samples: true
  reject_old_samples_max_age: 168h

chunk_store_config:
  max_look_back_period: 0s

table_manager:
  retention_deletes_enabled: false
  retention_period: 0s
To learn more about config-file follow link.
Install Grafana for visualization
We can install Grafana through linux package manager.
Use the given command to install some requisite packages –
sudo apt install -y gnupg2 curl

# Use the following command to add the Grafana GPG key to your system –
curl https://packages.grafana.com/gpg.key | sudo apt-key add -

# Run the given command to add Grafana package repository to your system –
sudo add-apt-repository "deb https://packages.grafana.com/oss/deb stable main"

sudo apt update
sudo apt -y install grafana

# Once the package is installed, use the following command to start and enable Grafana services –

sudo systemctl start grafana-server
sudo systemctl enable grafana-server
sudo systemctl status grafana-server
Install Loki Agent
Grafana Loki supports the following official clients for sending logs:
- Promtail
- Docker Driver
- Fluentd
- Fluent Bit
- Logstash
- Lambda Promtail
We will use Promtail for logging agent with Loki.
Promatil Installations – With each Loki releases we will find Promtail binary in Assessts.
While running binary pass the config file. Please find an example of config file below.
server:
  http_listen_port: 9080
  grpc_listen_port: 0

positions:
  filename: /var/log/positions.yaml

clients:
  - url: http://Loki_server_ip:3100/loki/api/v1/push

scrape_configs:
- job_name: system
  static_configs:
  - targets:
      - localhost
    labels:
      job: agent1
      instance:
      __path__: /var/log/*log
In Config file we give diff labels which are used to identify agents and we can group identical server logs and can apply different filter by running query.
Log analysis
Step 1 – Login Grafana add loki as Datasource.
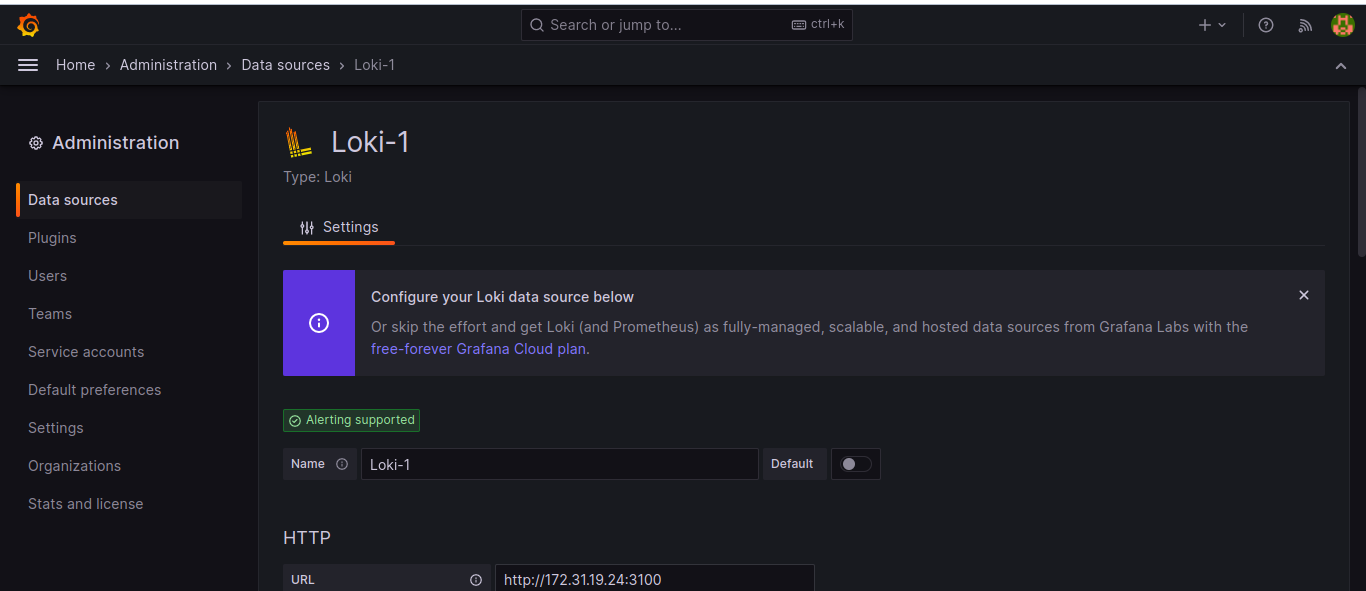
Step 2 – we can verify that logs are coming or not in explore section. Select the the Loki Datasource and select label which you have given in config file of Promtail of your agents. You will find logs of that particular server below in sheet and Graph form.
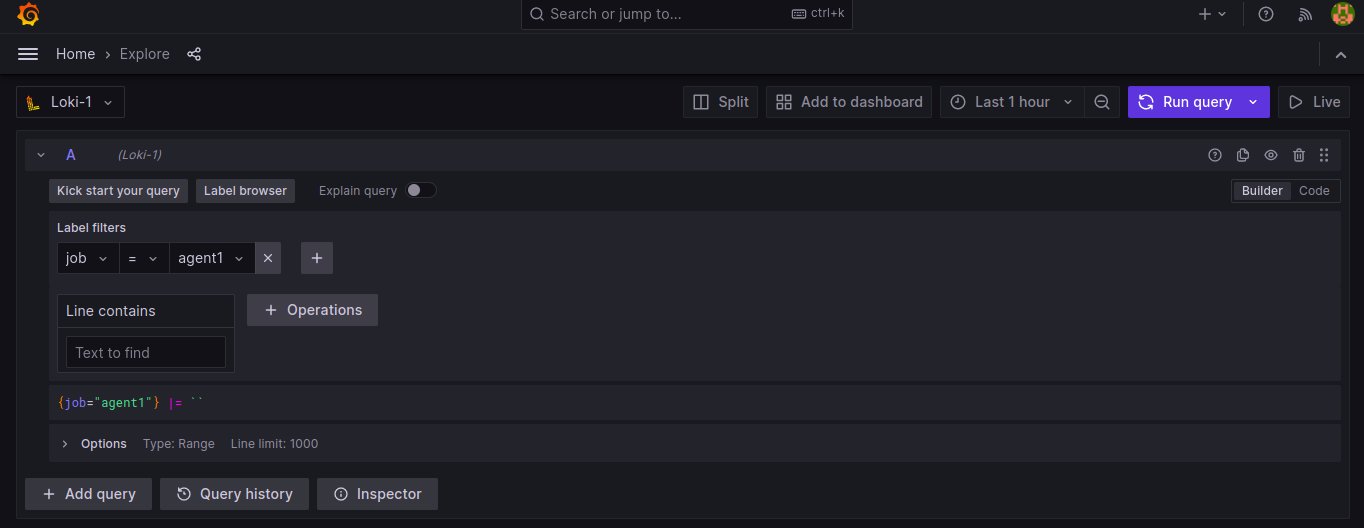

Step 3 – Create Grafana Dashboards, we need use loki query lanaguage LogQL and with helps of its we will create Graphs.
To get the syslogs from agent 1 we will run query as shown below in snapshots.

In same way we create more panel for our Dashboards.

Conclusion
Grafana Loki can help you monitor and troubleshoot your microservices architecture efficiently and effectively. It provides a cost-effective, scalable, and easy-to-use solution for storing, searching, and analyzing logs from your applications and infrastructure.
Blog Pundits: Mehul Sharma and Sandeep Rawat
OpsTree is an End-to-End DevOps Solution Provider.
Connect with Us