
Torture the data, and it will confess to anything.
Ronald Coase
WHAT IS ELASTIC SIEM
Elastic SIEM (Security Information and Event Management) is a new feature provided by Elastic NV. Using Elastic SIEM we can track and maintain important events that concern us.
Events are actions that reflect something that has happened.
Examples – Let’s say we have an important instance that hosts a service. Now we want to know successful and failed login attempts made to this instance.
Also, let’s say we have “/etc/nginx” directory and we want to track events, if any, in this directory. Simply put, changes that have been made in this directory i.e. file are created, deleted, or updated.
All of this can be done. Since it’s better to show Visualization than just definitions, that’s what we’ll do.
OBJECTIVE
Below are the objectives of this blog:
- We will install auditbeat on an important instance (Ubuntu) and configure auditbeat.yml in a secured way so that it will send events to elasticsearch.
- Visualise various events on Kibana
- File-Integrity Module
- System Module
- Auditd Module
- Data Exporters
Install Auditbeat
Here, we are going to install auditbeat on an instance where events are important to us. Our OS is ubuntu.
curl -L -O https://artifacts.elastic.co/downloads/beats/auditbeat/auditbeat-7.7.1-amd64.deb
sudo dpkg -i auditbeat-7.7.1-amd64.deb
If your OS is different, you may download the package from the given link.
https://www.elastic.co/downloads/beats/auditbeat
Now it is required to add elasticsearch host, username, and password in auditbeat.yml configuration file.
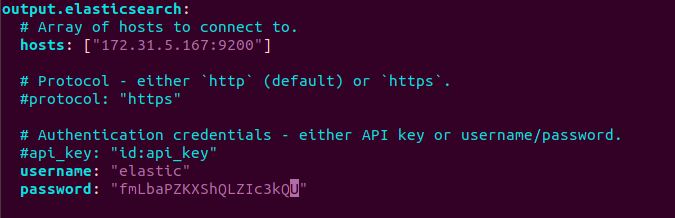
For password, we will be using auditbeat keystore. It is not recommended to enter a password in plain text format as shown in the above example.
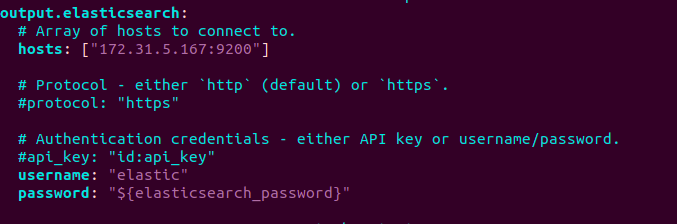
sudo auditbeat keystore create
sudo auditbeat keystore add elasticsearch_password
A prompt will be shown asking for value.

Now our password is stored in elasticsearch_password variable. Let’s use this variable in the config file.
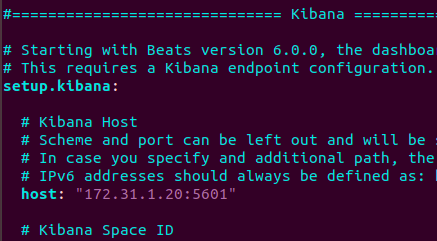
Now add kibana host.
We have successfully set up our auditbeat. Let’s test it.
sudo auditbeat setup
sudo service auditbeat start
Visualise various events in Kibana
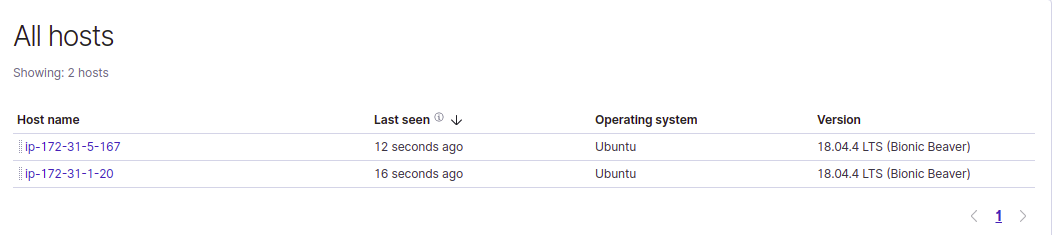
All hosts under the hosts section tell us the total number of hosts we have configured.
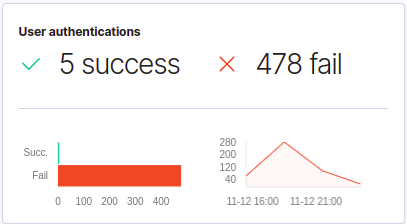
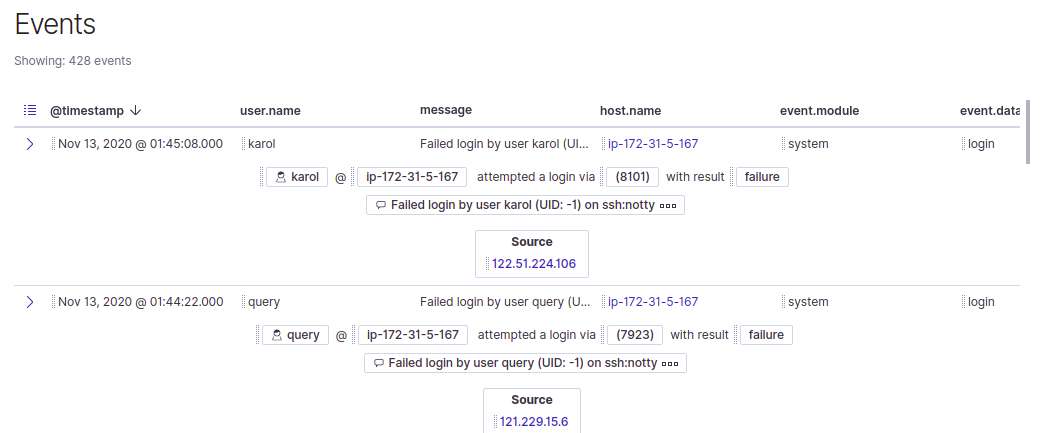
Here we can see that there have been 5 success login attempts and 478 failed attempts made for both hosts.
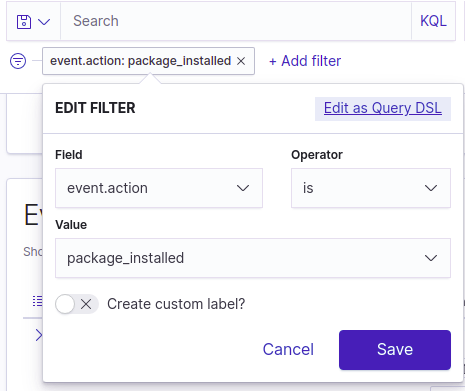
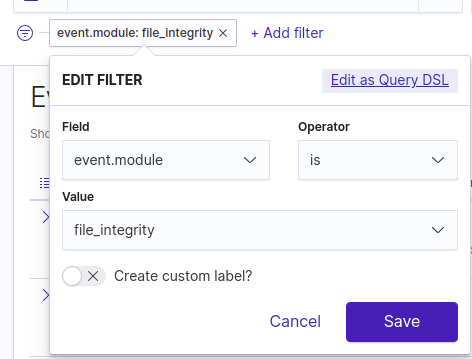
Since the most important part of SIEM is events, we can use KQL(Kibana query Language) and add filters to go through them.
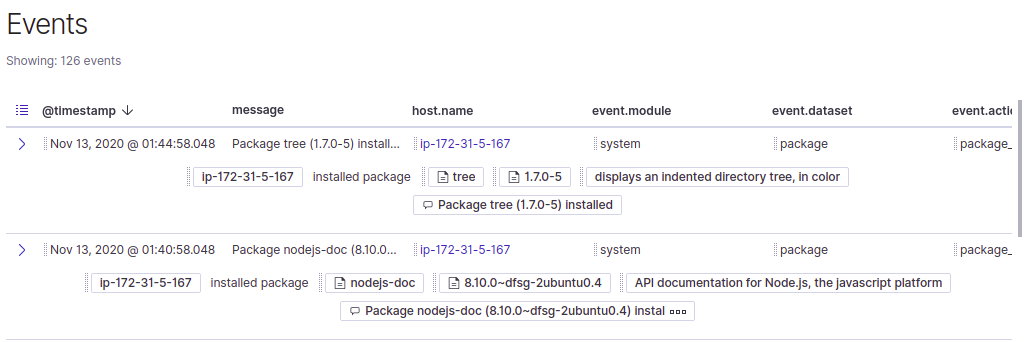
Example:- After audit beat, I installed Nodejs and tree using apt-get. Let’s see our relevant data.
Below we can see relevant events.
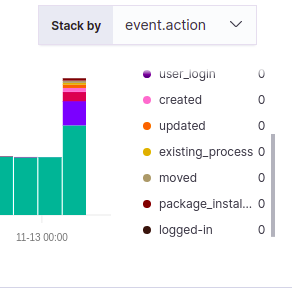
Let’s see various login attempts made on our instance. Use and set event.action to user_login.
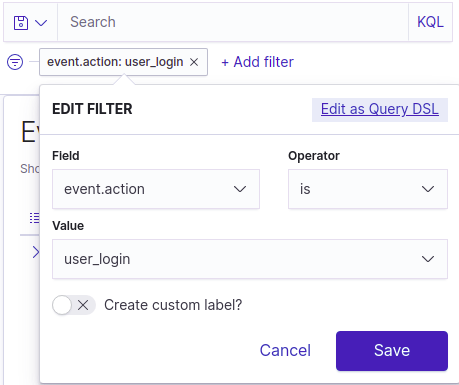
Event Action
File Integrity Module
The audit beat has three available modules. System, File Integrity, and auditd.
File Integrity module handles file related events.
It uses Linux kernel API, i.e. inotify (An API that provides a mechanism for monitoring filesystem events). So, if anyone is using a lower version of Linux or if inotify is not supported in their version, then this module will not be available.
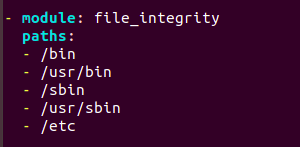
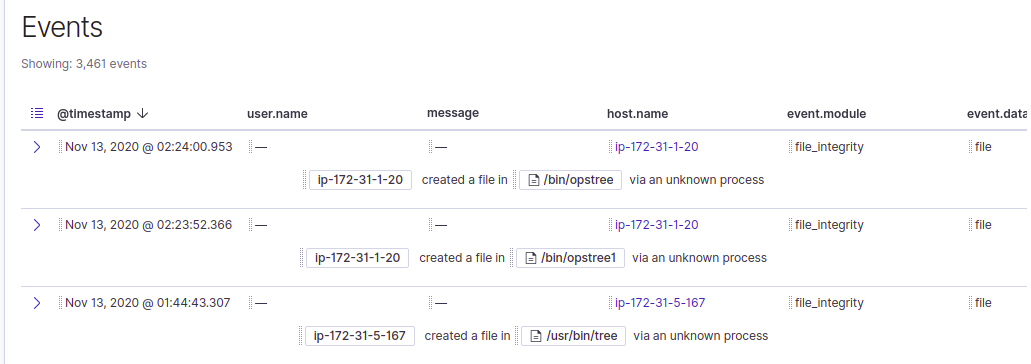
Let’s add some files in /bin and check for the relevant events.
Custom Directory or File
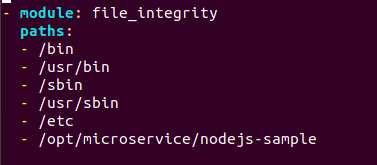
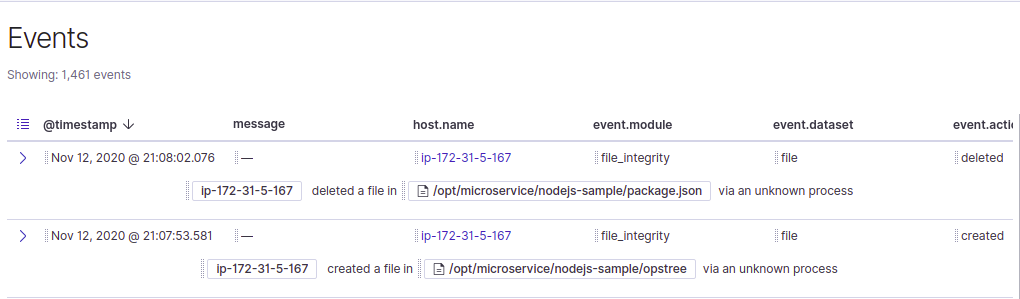
Here, I have a sample nodejs application which is being served. So I want to know if any changes have been done to this directory.
System Module
The system Module collects important events related to a system.
- host ( Host Information like OS, Kernel Version)
- login ( Contain Login related Information like Failed Attempts)
- package ( Contain Information like package installed or deleted)
- process ( Process that has been started or stopped recently )
- socket (Monitor network traffic to and from running processes)
- user (User-created or deleted)
Example:- Earlier we checked for login attempts made to our instance, the events displayed there were mainly because of this module.
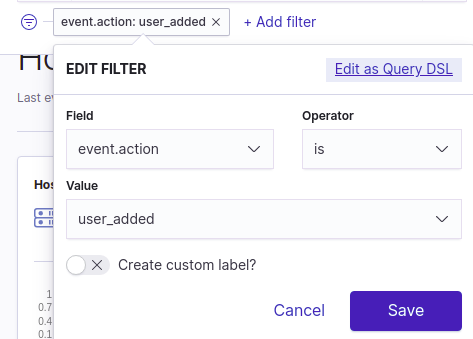
Now let’s say I want to know if a user has been added or deleted recently.
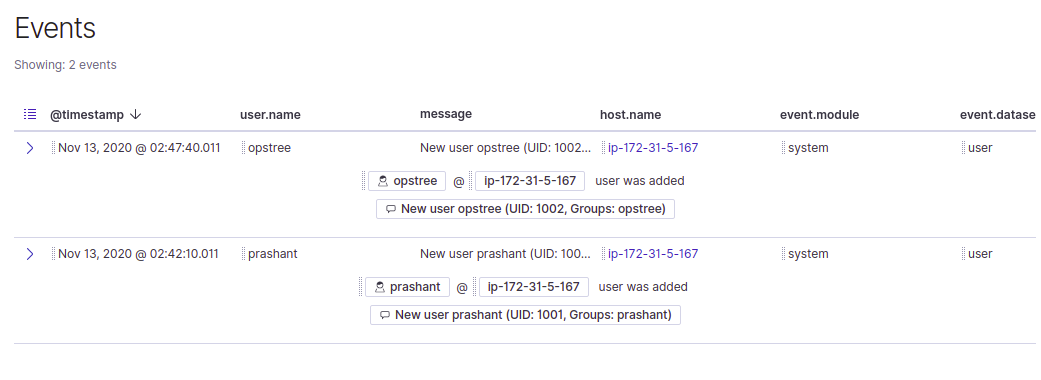
It is better to remove the socket from system module as it creates a large noise ratio.
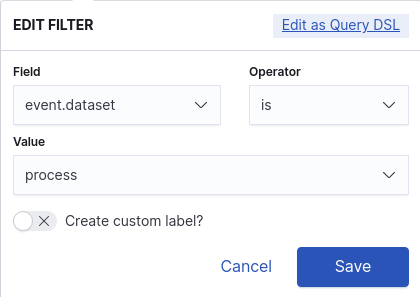
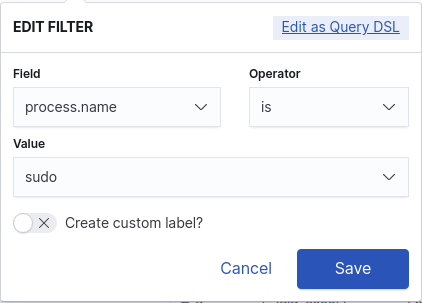
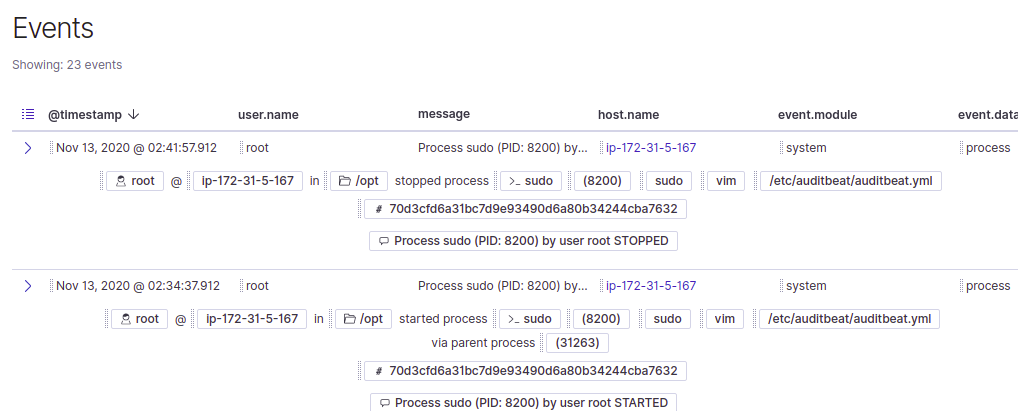
If I want to check processes that have been executed with root privilege, I can do it with the help of this nested query
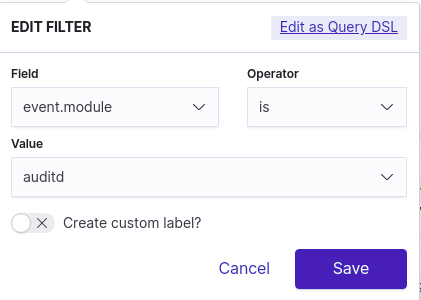
Auditd Module
Auditd module receives events from the Linux Audit Framework which is a part of the Linux kernel.
Using this module we can track specific syscalls that have been called e.g open, truncate, create. Also, files and directories that have been accessed.
System call auditing lets you track your system’s behavior on a level even below the application level.
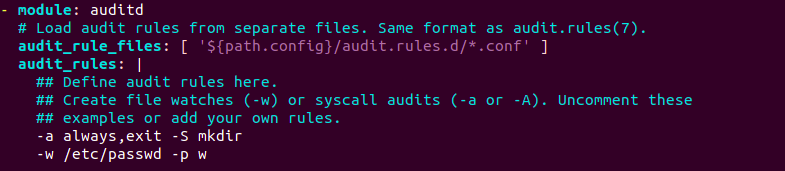
Example rule:- -a always,exit -S mkdir
Here the -a option adds system call rules whereas -d option will delete. This rule triggers an event whenever the mkdir system call is exited (always,exit). Apart from exit one can use (always,entry). The -S option adds the name of the system call which in this case is mkdir.
Another example:- -w /etc/passwd -p w
Here -w stands for to watch a file. All system calls requesting write permissions to this file are analyzed.
Let’s add these rules to our auditbeat.yml
I have created a directory and using root privileges, changed /etc/passwd file. Let’s see if mkdir syscall is triggered or not and the same for /etc/passwd.
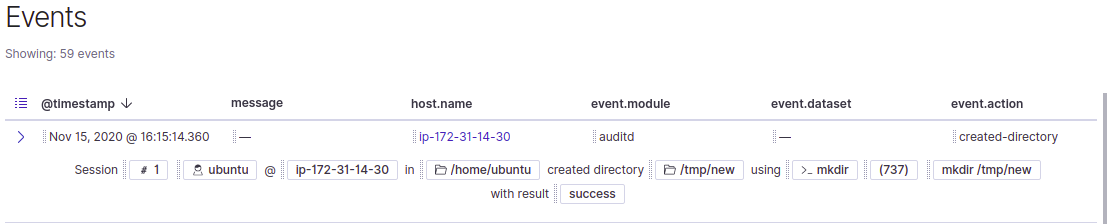
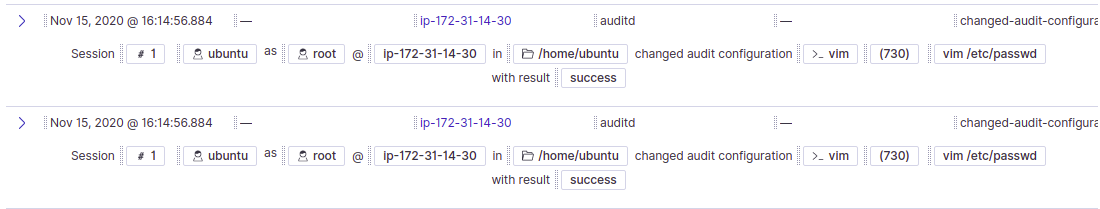
So we can check for any syscall being called and watch any file. We can also replace mkdir with other systemcall.
Data Exporters
Elastic SIEM also offers compatibility with other exporters.
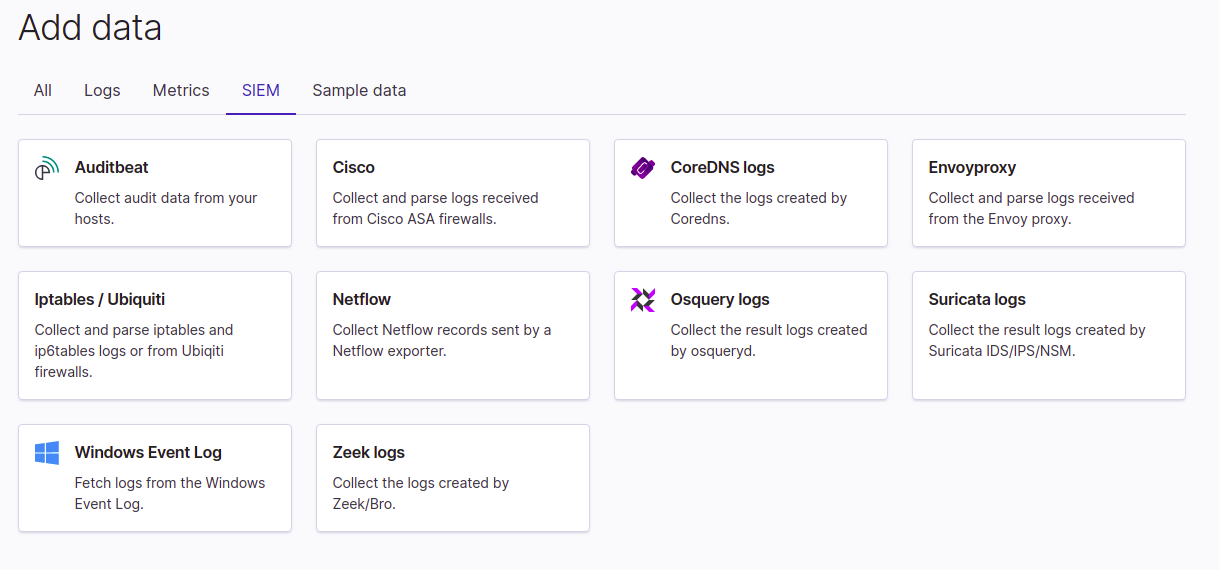
Let’s say you have CISCO ASA Firewall, a security device that has firewall, antivirus, intrusion prevention, and VPN capabilities. Select Cisco and configure it and then you will be able to centrally mange logs and events of Cisco ASA Firewall.
You can use Elastic SIEM to centrally manage your events from other exporters as shown in Figure 24.
Conclusion
Elastic SIEM is one of the top elite tools to see and centrally manage events.
Here we have discussed Elastic SIEM, its events and how can we customize it. We also discussed different modules of auditbeat and showed, briefly, their purpose and use case.
Opstree is an End to End DevOps solution provider