In today’s highly interconnected and technology-driven world, maintaining a stable and efficient network infrastructure is crucial for businesses of all sizes. Network & infra-monitoring tools play a vital role in ensuring the smooth operation of infrastructure by providing real-time visibility into system and network performance, identifying bottlenecks, and enabling proactive troubleshooting.
PRTG Network Monitor stands out as a powerful and easy-to-use tool that simplifies the monitoring process and empowers administrators to keep their environment running smoothly. In this blog post, we will explore the features and benefits of PRTG Network Monitor.
What is PRTG?
PRTG Network Monitor, developed by Paessler AG, is a robust and user-friendly network monitoring tool that offers a wide range of features to effectively monitor network devices, servers, and applications. With its centralized monitoring system, PRTG provides administrators with a holistic view of their network infrastructure, allowing them to detect and resolve issues before they impact users or cause downtime.
Why PRTG Stands Out in the Competition?
1. Comprehensive Network Monitoring
PRTG Network Monitor supports a vast array of network devices and protocols, making it highly versatile and adaptable to diverse network environments. It allows administrators to monitor the availability, performance, and health of routers, switches, servers, virtual machines, and more. Additionally, PRTG can monitor bandwidth usage, network traffic, and latency, enabling administrators to identify potential bottlenecks and optimize network performance.

2. Easy-to-Use Interface
One of the standout features of PRTG Network Monitor is its intuitive and user-friendly interface. The tool provides administrators with a centralized dashboard that offers a clear overview of the devices’ status, performance, and alerts. The customizable dashboards and graphs allow for easy visualization of key metrics, simplifying the monitoring process and enabling administrators to quickly identify and address network issues.
3. Alerting and Notifications
PRTG Network Monitor offers a robust alerting system that notifies administrators of any deviations or critical events in the network infrastructure. Alerts can be customized based on predefined thresholds, ensuring that administrators receive notifications for issues that require immediate attention. The tool supports various notification methods such as email, SNS, Amazon SES ,SMS, push notifications, and SNMP traps.
4. Historical Data and Reporting
PRTG Network Monitor stores historical data, allowing administrators to analyze network performance over time and identify patterns or trends. The tool provides comprehensive reporting capabilities, enabling administrators to generate customized reports on network availability, performance, and usage.
5. Maps Integration
PRTG Network Monitor allows us to create custom maps of your network architecture of your environment/datacenters to visualize the traffic flow and monitor the bottleneck and troubleshoot the issue without hampering other devices attached to the network..
How PRTG Works?
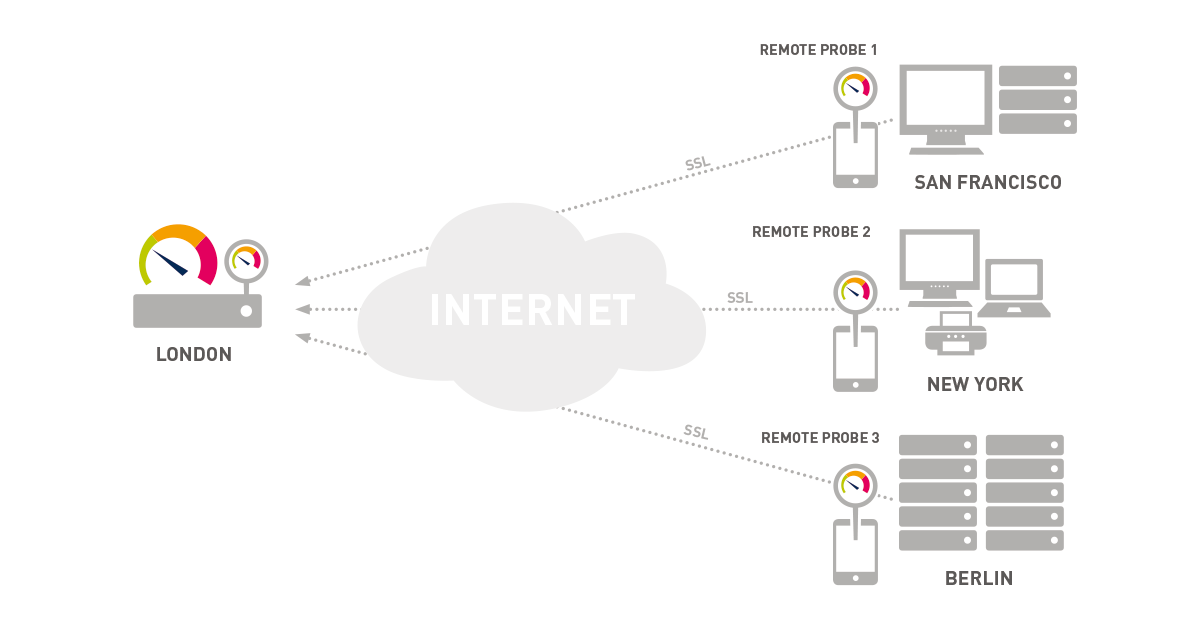
PRTG requires the installation of probes or agent on the target machine which carry connection with all other devices you want to monitor and connect those assets using SNMP, Windows WMI, SSH access or API keys for Fortigate/Cisco Firewall to monitor IPsec tunnel and VPN.
- Monitoring Configuration: After installing PRTG, you start by configuring what you want to monitor. This includes adding devices (such as servers, routers, switches, etc.) and specifying the monitoring parameters for each device. PRTG supports a wide range of protocols and technologies for monitoring, including SNMP, WMI, NetFlow, Ping, HTTP, and many others.
- Sensor Deployment: PRTG uses sensors to monitor different aspects of a network device or service. A sensor is a small program or script that collects specific data from a target. For example, you can deploy a Ping sensor to check the availability of a device, an SNMP sensor to monitor CPU usage on a server, or a NetFlow sensor to capture network traffic data.
- Data Collection: Once the sensors are deployed, PRTG starts collecting data from the monitored devices at regular intervals. The data collected can include metrics such as CPU utilization, memory usage, network traffic, response times, and more, depending on the type of sensors used.
- Alerting and Notifications: PRTG allows you to set up alerting rules based on predefined thresholds or conditions. If a monitored parameter exceeds a specified limit or meets certain criteria, PRTG can trigger notifications to alert you. Notifications can be sent via email, SMS, push notifications, or even executed custom scripts.
- Data Visualization: PRTG provides a web-based interface where you can view and analyze the collected data. It offers various types of customizable dashboards, maps, graphs, and reports to visualize the network performance and status. You can also create custom reports to monitor specific aspects of your network infrastructure.
- Historical Data and Analysis: PRTG stores the collected data in a database, allowing you to analyze historical trends and performance over time. This data can be valuable for capacity planning, troubleshooting, and identifying long-term patterns or anomalies in your network.
- Additional Features: PRTG offers several additional features, such as network mapping, traffic analysis, remote probe functionality, and integrated reporting. It also supports multi-user access with role-based permissions, allowing different teams or individuals to have their own views and access levels.
How can we monitor Logs for the Tool and Sensors?
- Event Logs: PRTG maintains its own event logs that capture important system events, such as service startup, sensor and device status changes, notifications sent, and user activities.
- Sensor Logs: Each sensor in PRTG has its own log, which records the monitoring data collected and any related events. Sensor logs can be useful for troubleshooting specific sensors or investigating performance issues.
- Notifications Logs: PRTG keeps a log of all notifications sent by the system. This log includes information such as the recipient, delivery status, and timestamp of each notification.
- Syslog and SNMP Traps: PRTG can receive and process syslog messages and SNMP traps from network devices. These messages are typically generated by devices themselves to report events or errors. PRTG can store and display these messages in its own log files, allowing you to analyze and respond to network device events centrally.
- Reporting: PRTG offers various reporting capabilities that allow you to generate detailed reports based on collected monitoring data. Reports can include information such as uptime/downtime, response times, traffic statistics, and more. These reports can be useful for historical analysis, capacity planning, and compliance purposes.
Costing?
PRTG Network Monitor offers several pricing options based on the number of sensors you require. A sensor is a monitoring point that measures a specific aspect of a network device or service. Here are the key pricing details for PRTG:
- Freeware: PRTG offers a free version that allows monitoring up to 100 sensors. This version is suitable for small-scale networks or for individuals who want to monitor a limited number of devices.
- Commercial Licenses: For larger networks or organizations with more extensive monitoring needs, PRTG provides commercial licenses with various sensor limits. The pricing is based on the number of sensors you require. Here are some common licensing tiers as of my knowledge cutoff date (September 2021):
- PRTG 500: Allows monitoring up to 500 sensors.
- PRTG 1000: Allows monitoring up to 1,000 sensors.
- PRTG 2500: Allows monitoring up to 2,500 sensors.
- PRTG XL1: Allows monitoring up to 5,000 sensors.
- PRTG XL5: Allows monitoring up to 10,000 sensors.
- PRTG XL10: Allows monitoring up to 20,000 sensors.
- PRTG XL50: Allows monitoring up to 50,000 sensors.
- PRTG XL100: Allows monitoring up to 100,000 sensors
Conclusion!
It’s important to note that the choice of a network monitoring tool depends on specific requirements, preferences, and the nature of the network environment. While PRTG has numerous benefits, it’s recommended to evaluate different tools based on your unique needs to make an informed decision.
In the next part of this blog, I will explain more about adding groups, devices, and sensors using a hierarchal structure for accessing devices and Windows AD integration with On-Prem Domain.
Blog Pundits: Mehul Sharma and Sandeep Rawat
OpsTree is an End-to-End DevOps Solution Provider.
Connect with Us