Introduction
The Cloud Intelligence Dashboards represent an open-source framework crafted and nurtured by a dedicated community of AWS enthusiasts. These dashboards are designed to deliver actionable insights and scalability for organizations, with a focus on customer satisfaction. The functionalities of these dashboards extend to fostering financial accountability, optimizing costs, monitoring usage goals, implementing governance best practices, and attaining operational excellence across all Well-Architected pillars. It includes multiple dashboards:
- CUDOS Dashboard
- Cost Intelligence Dashboard
- KPI Dashboard
- TAO Dashboard
- Compute Optimizer Dashboard
- Cost Anomaly Dashboard
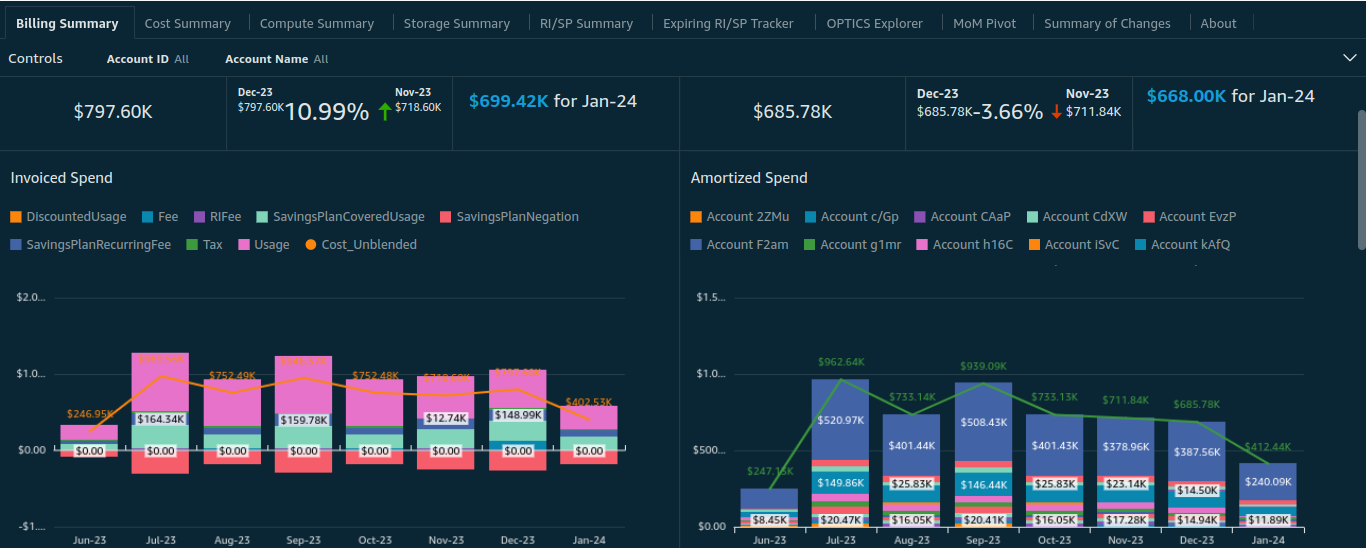
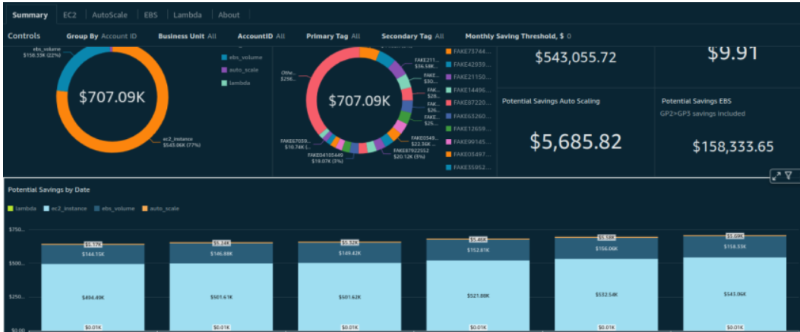
CUDOS Dashboard
The CUDOS Dashboard offers comprehensive overviews and operational insights, allowing users to delve into resource-specific details. Users can discover automatically generated recommendations for cost optimization and actionable insights within the CUDOS Dashboard. These insights readily apply to FinOps practitioners, Product Owners, and Engineering teams. The dashboard facilitates swift identification of usage spikes and reveals uncertainties in AWS consumption, highlighting specific resources that can be optimized.
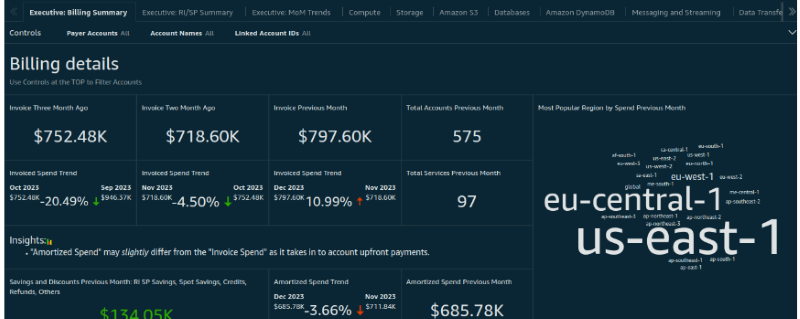
Cost Intelligence Dashboard
The Cost Intelligence Dashboard (CID) is a customizable and user-friendly platform designed to establish the groundwork for your personalized cost management and optimization tool. Executives, directors, and individuals responsible for cloud financials within the CFO’s domain will discover the CID to be easily navigable and pertinent to their specific use cases. No or minimal technical expertise or familiarity with AWS Services is necessary to leverage the benefits of CID.
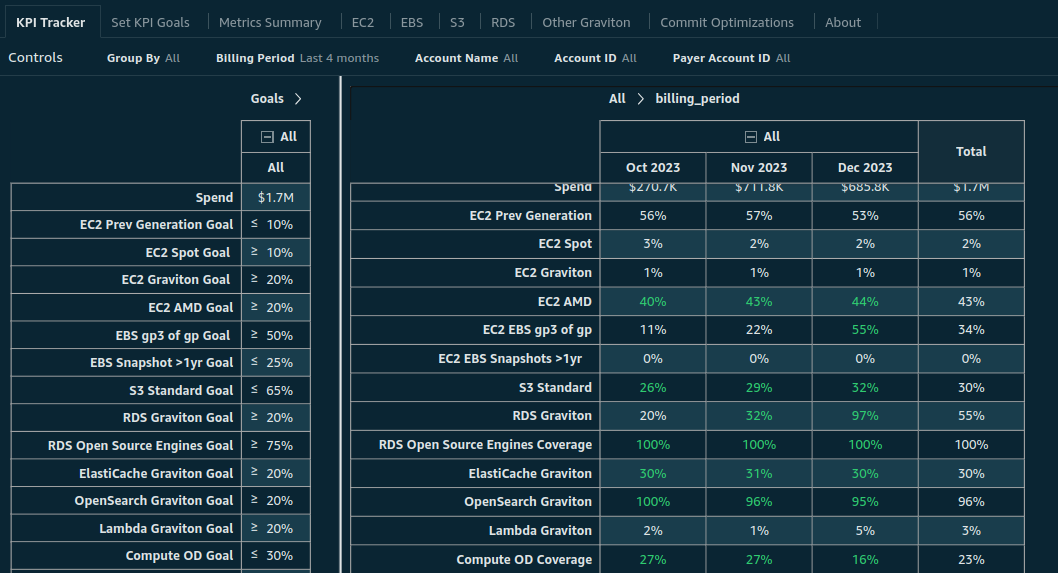
KPI Dashboard
The Key Performance Indicator (KPI) and Modernization Dashboard facilitate the integration of DevOps and IT infrastructure with Finance and the C-Suite within your organization, promoting more efficient and effective growth on AWS. This dashboard empowers you to establish and monitor modernization and optimization objectives, including metrics such as On-Demand percentage, Spot adoption, and Graviton usage. By empowering each line of business to define and track usage goals and enabling your cloud center of excellence to provide organization-wide recommendations, you can achieve enhanced efficiency and foster quicker innovation on AWS.
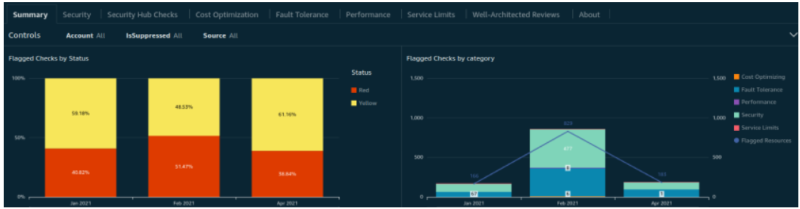
TAO Dashboard
The Organizational Trusted Advisor (TAO) Dashboard comprehensively views all potential cost optimization opportunities and automatically identifies idle resources. It also highlights AWS Trusted Advisor risks and flagged resources across the Security, Reliability, and Performance pillars. TAO includes historical trends, enabling you to monitor the outcomes of optimization efforts over time.
Compute Optimizer Dashboard
The Compute Optimizer Dashboard assists your organization in visualizing and tracking right-sizing recommendations provided by AWS Compute Optimizer. These suggestions aid in identifying opportunities for cost savings related to over-provisioned resources, while also highlighting operational risks associated with under-provisioned ones.
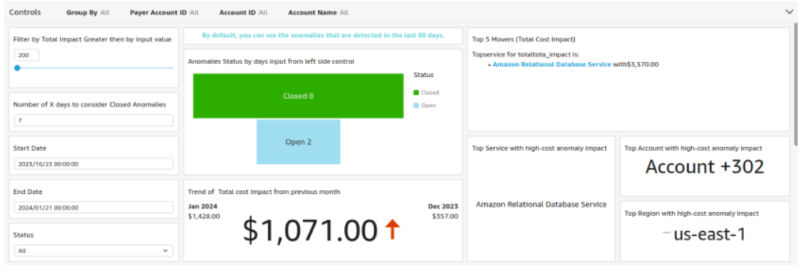
Cost Anomaly Dashboard
The Cost Anomaly Dashboard assists you in monitoring and visualizing insights derived from AWS Cost Anomaly Detection.
Architecture
AWS recommend deployment of the CUDOS, KPI, and Cost Intelligence Dashboards in a dedicated account separate from your Management (Payer) Account.
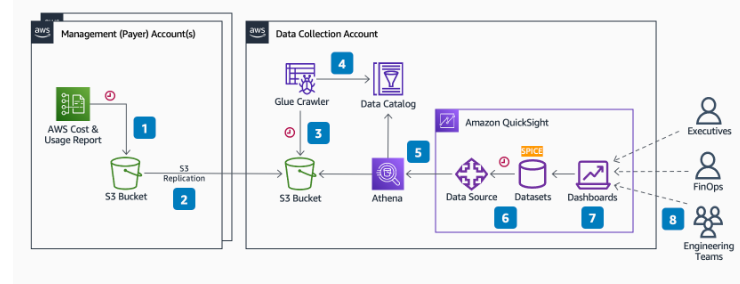
This architecture facilitates the aggregation of Cost and Usage Reports (CURs) from various sources into a single Data Collection Account. This is particularly beneficial if you seek visibility across multiple Management (Payer) Accounts.
Moreover, this aggregation approach proves valuable when access to the Management (Payer) account is unavailable, and there is a need for visibility across multiple Linked Accounts belonging to a single Business Unit.
Deployment
There is three main steps in deployment process:
- Deploy a bucket for aggregated CUR in the Data Collection Account
- Deploy CUR, bucket and a replication policy in Source Accounts (can be one or many Sources).
- Deploy Cloud Intelligence Dashboards (CID) Stack in Data Collection Account
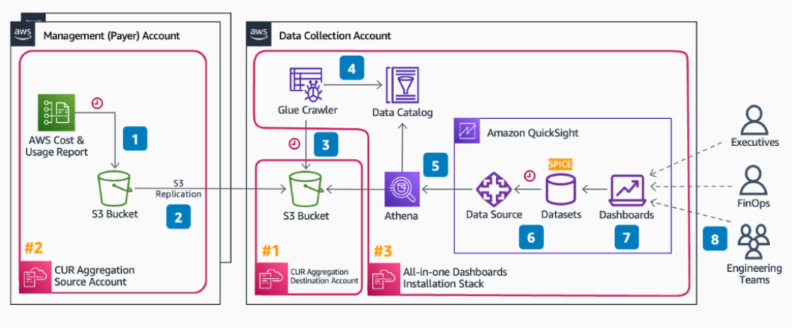
AWS also provide cloud formation stack for each steps:
- Establish a destination specifically designated for CUR (Cost and Usage Report) aggregation within the data collection account.
- Generate rules for Cost and Usage Reports (CUR) and replication within the Management/Payer/Source Account.
- Implement dashboards in the Destination/Data Collection Account.
Conclusion
- Cloud Intelligence Dashboards (CID) provide robust visualization tools for comprehensive insights into AWS usage and costs at the organizational level.
- Dedicated dashboards like CUDOS, KPI, and Cost Intelligence are available for users to optimize cloud financial management.
- The recommended architecture involves deploying CID in a separate Data Collection Account.
- This separate account facilitates scalability for aggregating Cost and Usage Reports (CURs) from multiple sources.
- The deployment process is facilitated by AWS CloudFormation stacks.
- It includes establishing a dedicated CUR destination and deploying CUR in Source Accounts.
- This approach enables organizations to gain granular AWS insights, optimize costs, enhance operational efficiency, and foster innovation on the AWS cloud platform.