Imagine you wake up one day, open your front door, and find huge wooden logs of different shapes and sizes placed in your front yard. On one of them is a note that says, “Well, here have ’em, all the logs, both structured and unstructured. Please deliver all the furniture by the end of the week or else … Now, if you’re inexperienced in “woodwork”, you need to start thinking. This is, more or less, how I felt when I was first assigned a task like this.
At the time, I faced a fair amount of difficulties bringing the logs from servers to visualize in kibana. The area which was most troubling and rewarding was figuring out logstash. This blog is a helpful summary of what I learned about logstash and how it helped. So, Ladies, Gentlemen, and others, sit tight and read on.
Needless to say, this blog is for beginners. Not just to ELK, but to logging as a whole.
Fortunately for us, computer geeks, we are seldom alone in our struggle. We usually have a whole international community online to help us through our pain. I have the same community to thank as well.
This is how we are gonna move, I have divided this blog in four sections. I’ll talk about four different things in each of them.
- Input logs visibility in logstash
- Bottlenecks I faced.
- Output?
- Configuration options
-
How to see the logs:
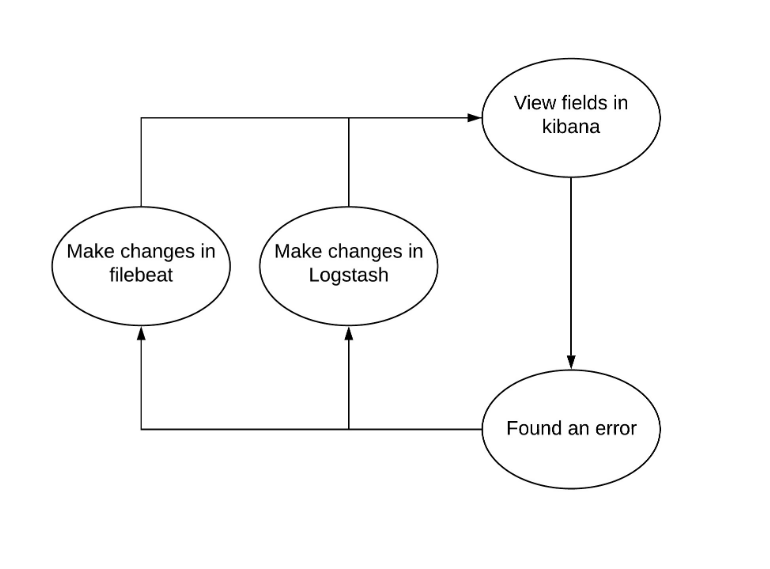
While setting up logstash pipeline, I kept running into a loop of trial and error.
Not only this, I couldn’t see the actual data coming from filebeat to logstash. This made filtering the logs a little more difficult than it had to be.
Turns out we can get out of this easily enough. All we have to do is start another instance of logstash with the right input and output options.
Goto /usr/share/logstash this is where logstash is installed in my case.
bin/logstash -f input-filter-output.conf --config.reload.automatic --path.data /tmp/test-filter
input-filter-output.conf file here contains custom configuration to go over our log lines in detail. Usually, people keep the output as stdout so that they can look at the processed log lines as they come.
Example file:
input { generator { count => 1 lines => [ ‘2020/01/08 13:42:29 RequestID: 251906c6-15ed-e972-5165-218675e2494b – URL:/healthcheck – processed in 0.000(s)’ ] } }
filter {
}
output { stdout { codec => rubydebug { metadata => true } } }
[ Are you looking: Cybersecurity Posture Management ]
2. Bottlenecks I faced:
Usually, when we are starting out, even simple problems feel like a bottleneck. It is only after one spends enough time than they realize if it really was one. I will explain my hindrances and will leave that decision to you.
a.) Conditions: Since I had little idea about what an ‘event’ consists of, i.e., the actual data in log lines, I couldn’t decide how to put conditions on them. It was only after I used the technique described above that I was able to place required conditions for filtering my data.
b.) Grok: My log lines were unstructured and I had little experience with regular expressions so using grok patters to extract fields was a bit of a challenge. To be fair, it was quite a challenge until I figured out using regular expressions. It takes a little practice but once you figure it out, things become quite easy. Here are some useful links to understand regex.
https://ruby-doc.org/core-1.9.3/Regexp.html#class-Regexp-label-Anchors
https://www.ntu.edu.sg/home/ehchua/programming/howto/Regexe.html
Ofcourse, there are plenty other usful filters for all sorts of needs. I suggest going through docs and understand them. It will make the effort worth so much more.
c.) Performance: I was worried that grok parse failures are going to slow down my processing. So, I started looking around. Surprisingly, I found that it was what I wasn’t searching that could impact performance the most. We need to anchor our logs. Meaning, use ^,$,etc to tell regex engine where you pattern starts and ends. If you don’t, it will search in places it does not need to thereby impacting performance.
3. Output right logs to the right places
Well my concern wasn’t only limited to performance impact in grok failures. I also needed all defaulters to be rounded up in one place, wink wink. This would not only help me identify them but also fix what’s broken and optimise my setup. After all, logstash directly depends upon regex engine for performance in such cases. For this, I found out that there’s a file output. One can simply filter _grokparsefailure or _jsonparsefailure tags and redirect unhandled log lines to a file where they can later examine them. Isn’t that sweet!
4. Configuring Logstash for better performance
Logstash needs configuring for two major things if you ask me, performance and persistance. We’ve discussed the performance to some extent though there are a couple more things I’d like to add. Make sure to have enough heap space allocated to logstash according to server size. Configure it in jvm.options file kept in logstash configuration directory. It’s best practice to keep upper and lower limit, i.e., Xms and Xmx to the same size to reduce garbage collection overhead. To process more logs, given we have large enough machines, we can also start multiple workers to utilise all the processing power machine has to offer.
Let’s talk about persistence now. Earlier people used to cache data using kafka or redis. This, not only ensured data persistence but also saved elasticsearch from sudden burst of input. Now, however, logstash comes with inbuilt queuing mechanism. This configuration is called persistent queues in logstash. We can go through all the configuration options available, but we already have documentation for that. So, let’s not. Here’s an interesting piece of information though, if you are worried you may lose your data in overwhelming input situation, don’t be. Logstash is capable of handling back pressure, i.e., it will hold accepting more input when queue limit is reached, process the current logs and then start accepting again. We can also control durability of our data in such situations through provided options.
Conclusion
There’s a fair chance that using persistent queues will slow down performance of logstash since single pipeline uses single-threaded persistent queue. Mitigation is simple, use multiple workers and loadbalance your logs input. Setting up ELK is quite beneficial as we already know. What we don’t imagine is the level of perspective it gives about our infrastructure until, ofcourse, we set it up and see for ourselves. There’s so much that has been done and so much more we could do with it. Let’s do together and share.
Related Searches – DevOps solution provider | Cloud Engineering Services