Let’s first understand what Prometheus is:
Prometheus is an open-source monitoring solution built primarily for gathering and analyzing time-series data, with specific built-in tools making it appropriate for monitoring Kubernetes and other containerized environments. It is a cross-platform monitoring tool that lets you collect metrics from servers, containers, and applications and work with them all in the same way.
Now let’s understand Prometheus Architecture to know how it works:
Prometheus is a multi-component system. While the following integrates into a Prometheus deployment, there is flexibility in which of these pieces are actually implemented.
- Prometheus server (scrapes and stores metrics as time series data)
- client libraries for instrumenting application code
- push gateway (supports metrics collection from short-lived jobs)
- special-purpose exporters (Supports tools like HAProxy, StatsD, Graphite, etc.)
- alertmanager ( sends alerts based on triggers)
- additional support tools
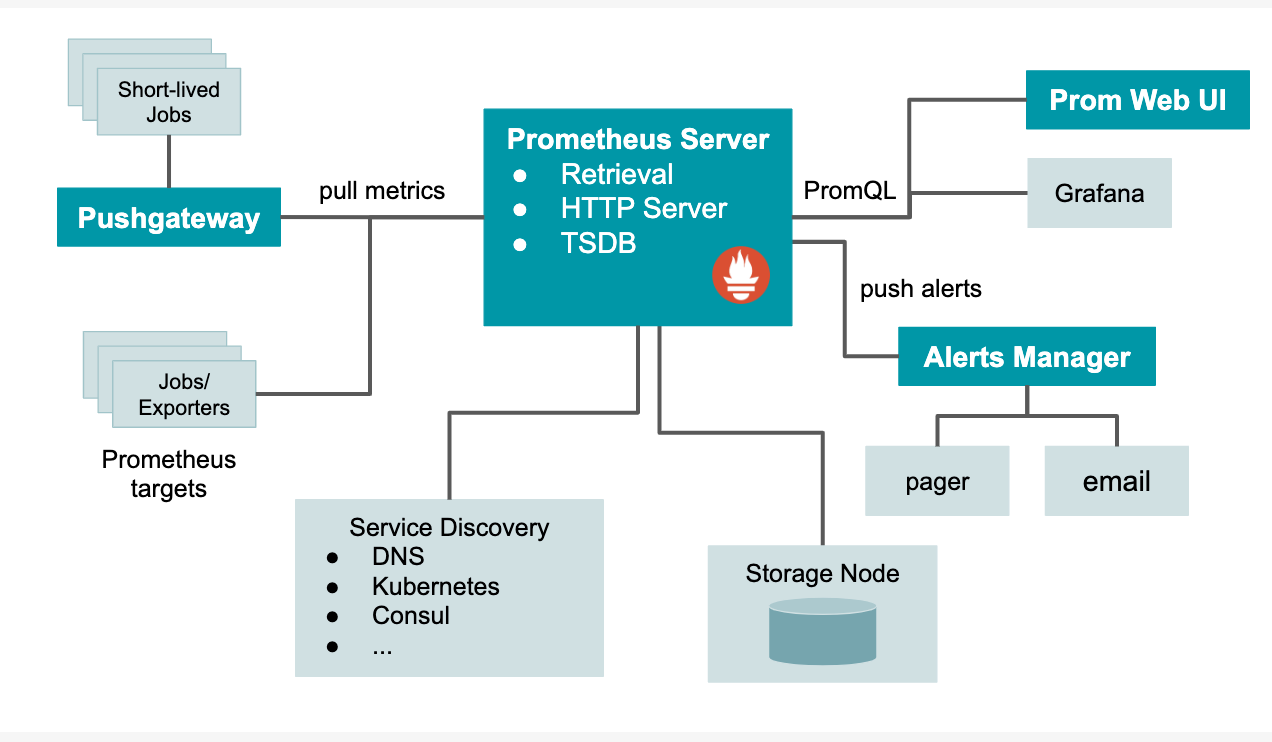
Prometheus can scrape metrics from jobs directly or, for short-lived jobs by using a push gateway when the job exits. The scraped samples are stored locally and rules are applied to the data to aggregate and generate new time series from existing data or generate alerts based on user-defined triggers. While Prometheus comes with a functional Web dashboard or other API consumers can be used to visualize the collected data, with Grafana being the de facto default.
Now let’s see why Prometheus has gained so much popularity as a monitoring tool:
- Prometheus is Pull based: it actively scrapes targets in order to retrieve metrics from them.
- Centralised control: the whole configuration is done on Prometheus server side and not on the client side which means you can decide who to scrape, and how often you should scrape them.
- In-built Alerting facility: Prometheus pushes alerts to the Alert manager via custom rules defined in configuration files. From there it will send notifications to different endpoints such as Slack, Google hangout etc.
- Service discovery: Prometheus can discover your targets dynamically and automatically scrap new targets on demand. Prometheus offers a variety of service discovery options for discovering scrape targets, including Kubernetes, Consul, and many others.
- Scalability: it is highly scalable. You can club different Prometheus servers to a single one using federation approach.
- Last but not the least, Prometheus provides a functional query language called PromQL(Prometheus Query Language), that lets the user select and aggregate time-series data in real-time.
[ Also Read: Introduction to Prometheus Monitoring ]
Prometheus provides 4 different types of metrics that work in most situations. Let’s have a brief discussion on each one.
- Counters: The counter metric type is used for any value that increases, such as a request count or error count. Importantly, a counter should never be used for a value that can decrease.
Here are a few situations when you can use counters:
- you want to record a value that only goes up
- you want to be able to later query how fast the value is increasing.
- Gauges: The gauge metric type can be used for values that go down as well as up, such as current memory usage or the number of items in a queue.
Here are a few situations when you can use gauges:
- you want to record a value that can go up or down
- you don’t need to query its rate
Below are a few examples where you can use gauges:
- memory usage
- queue size
- number of requests in progress
- Histograms: The histogram metric type measures the frequency of value observations that fall into specific predefined buckets. Like you could measure request duration for a specific HTTP request call using histograms. Rather than storing every duration for every request, Prometheus will make an approximation by storing the frequency of requests that fall into particular buckets.
Here are a few situations when you can use histograms:
- you want to take many measurements of a value, to later calculate averages or percentiles
- you’re not bothered about the exact values, but are happy with an approximation
- you know what the range of values will be upfront, so can use the default bucket definitions or define your own
Below are a few examples where you can use histograms:
- request duration
- response size
- Summaries: Summaries and histograms share a lot of similarities. Summaries preceded histograms, and the recommendation is very much to use histograms where possible.
Here are a few situations when you can use summaries:
- you want to take many measurements of a value, to later calculate averages or percentiles
- you’re not bothered about the exact values, but are happy with an approximation
- you don’t know what the range of values will be upfront, so cannot use histograms
Below are a few examples where you can use summaries:
- request duration
- response size
Conclusion
We have discussed what Prometheus is, how does it work and why it is most commonly used industry-wide. Prometheus uses different metrics which are pulled from servers and we have discussed major 4 metrics which you will encounter in day-to-day life.
Hope this blog can answer your queries.
Will meet soon with another blog till then stay safe
Blog Pundit: Bhupender rawat and Adeel Ahmad
Opstree is an End to End DevOps solution provider
Related Searches – Data Engineering Services | AWS Partner