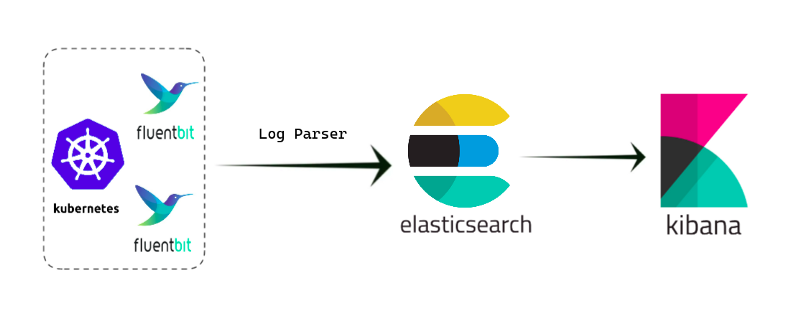
In this blog, we will see how we can deploy the Elasticsearch, Fluent-bit, and Kibana (EFK) stack on Kubernetes. EFK stack’s prime objective is to reliably and securely retrieve data from the K8s cluster in any format, as well as to facilitate anytime searching, analyzing, and visualizing of the data.
What is EFK Stack?
EFK stands for Elasticsearch, Fluent bit, and Kibana.
Elasticsearch is a scalable and distributed search engine that is commonly used to store large amounts of log data. It is a NoSQL database. Its primary function is to store and retrieve logs from fluent bit.
Fluent Bit is a logging and metrics processor and forwarder that is extremely fast, lightweight, and highly scalable. Because of its performance-oriented design, it is simple to collect events from various sources and ship them to various destinations without complexity.
Kibana is a graphical user interface (GUI) tool for data visualization, querying, and dashboards. It is a query engine that lets you explore your log data through a web interface, create visualizations for event logs, and filter data to detect problems. Kibana is being used to query elasticsearch indexed data.
Why do we need EFK Stack?
Using the EFK stack in your Kubernetes cluster can make it much easier to collect, store, and analyze log data from all the pods and nodes in your cluster, making it more manageable and more accessible for different users.
The kubectl logs command is useful for looking at logs from individual pods, but it can quickly become unwieldy when you have a large number of pods running in your cluster.
With the EFK stack, you can collect logs from all the nodes and pods in your cluster and store them in a central location. It allows you to quickly troubleshoot issues and identify patterns in your log data.
It also enables people who are not familiar with using the command line to check logs and keep track of the Kubernetes cluster and the applications that are deployed on it.
It also allows you to easily create alerts, dashboards, and create monitoring and reporting capabilities that can give you an overview of your system’s health and performance, and It will notify you in real-time if something goes wrong.
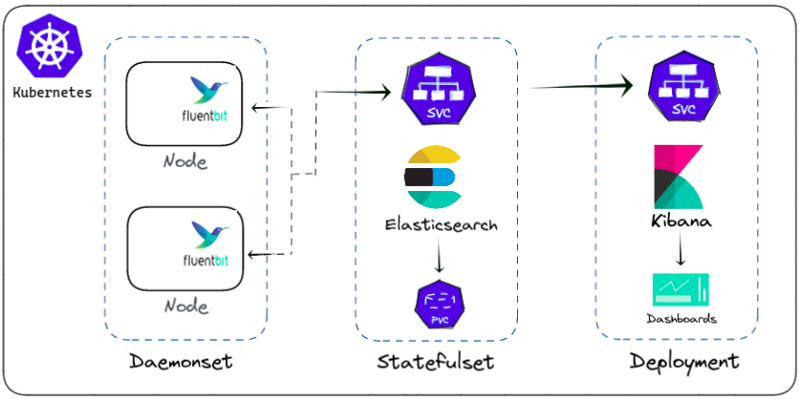
In this tutorial, we will be deploying EFK components as follows:
Elasticsearch is deployed as statefulset as it stores the log data.
Kibana is deployed as deployment and connects to elasticsearch service endpoint.
Fluent-bit is deployed as a daemonset to gather the container logs from every node. It connects to the Elasticsearch service endpoint to forward the logs.
So let’s get started with EFK stack deployment.
Creating a Namespace
It’s a good practice to create a separate namespace for every functional unit in Kubernetes. By creating a namespace for each functional unit, you can easily see which resources belong to which unit and manage them accordingly.
let’s create a namespace
This file contains hidden or bidirectional Unicode text that may be interpreted or compiled differently than what appears below. To review, open the file in an editor that reveals hidden Unicode characters.
Learn more about bidirectional Unicode characters
Let’s apply the manifest file created above, run the following command:
$ Kubectl apply -f namespace.yaml
Creating a Secret
Secrets in Kubernetes (K8s) are native sources for storing and managing sensitive data such as passwords, cloud access keys, or authentication tokens. You must distribute this information across your Kubernetes clusters while also protecting it.
Let’s create a secret for an elasticsearch password to make Kibana logging protected.
This file contains hidden or bidirectional Unicode text that may be interpreted or compiled differently than what appears below. To review, open the file in an editor that reveals hidden Unicode characters.
Learn more about bidirectional Unicode characters
Let’s apply the manifest file created above, run the following command:
$ Kubectl apply -f secrets.yaml
Deploy Elasticsearch as Statefulset
Deploying Elasticsearch as a StatefulSets provides stable unique network identities and stable storage. Elasticsearch stores a large amount of data and it’s important that data stored in Elasticsearch should be persisted and available even if the pod is deleted or recreated.
Creating the Headless Service
Now Let’s set up elasticsearch, a Kubernetes headless service that will define a DNS domain for pods. A headless service lacks load balancing and has no static IP address.
Let’s create a Headless Service for an elasticsearch.
This file contains hidden or bidirectional Unicode text that may be interpreted or compiled differently than what appears below. To review, open the file in an editor that reveals hidden Unicode characters.
Learn more about bidirectional Unicode characters
Let’s apply the elasticsearch service file created above, run the following command:
$ Kubectl apply -f es-svs.yaml
Creating the Elasticsearch StatefulSet
Deploying Elasticsearch as a StatefulSets pods are created and deleted in a specific order, ensuring that your data is not lost. This is especially useful for Elasticsearch, as it helps ensure that data is not lost during deployments and scaling events.
When you create a StatefulSet with a Persistent Volume Claim (PVC) template, the default storage class will be used if no custom storage class is specified. To use a custom storage class for the PVCs created by a StatefulSet, you can specify the storage class in the volumeClaimTemplates section of the StatefulSet definition.
Let’s create a StatefulSets for an elasticsearch.
This file contains hidden or bidirectional Unicode text that may be interpreted or compiled differently than what appears below. To review, open the file in an editor that reveals hidden Unicode characters.
Learn more about bidirectional Unicode characters
The status of the Elasticsearch cluster will be shown in the output. If all of the steps were performed properly, the status should be ‘green’.
Let’s move on to Kibana now that we have an Elasticsearch cluster up and running.
Deploy Kibana as Deployment
Deploying Kibana as a Deployment allows you to easily scale the number of replicas up or down to handle changes in load. This is especially useful for handling large amounts of data and dealing with periods of high traffic and helps you to take advantage of Kubernetes features such as automatic self-healing and automatic scaling which can save resources and cost for running Kibana pods.
Creating the Kibana Service
Let’s make a NodePort service to access the Kibana UI via the node IP address. For demonstration purposes or testing, however, it’s not considered a best practice for actual production use. The Kubernetes ingress with a ClusterIP service is a more secure and way to expose the Kibana UI.
Let’s create a Service for Kibana.
This file contains hidden or bidirectional Unicode text that may be interpreted or compiled differently than what appears below. To review, open the file in an editor that reveals hidden Unicode characters.
Learn more about bidirectional Unicode characters
Let’s apply the kibana service file created above, run the following command:
Kubectl apply -f kibana-svc.yaml
Creating the Kibana Deployment
Kibana can be set up as a simple Kubernetes deployment. If you look at the Kibana deployment manifest file, you’ll notice that we have an env variable ELASTICSEARCH_URL defined to configure the Elasticsearch cluster endpoint. Kibana communicates to elasticsearch via the endpoint URL.
Let’s create a Deployment for Kibana.
This file contains hidden or bidirectional Unicode text that may be interpreted or compiled differently than what appears below. To review, open the file in an editor that reveals hidden Unicode characters.
Learn more about bidirectional Unicode characters
Let’s check all Kibana pods come into the running state.
kubectl get pods -n kube-logging
Once the pods for Elasticsearch, Fluent-bit, and Kibana have entered the running state, you can verify the deployment by accessing the Kibana UI.
To check the status using the UI access of the cluster, you can use the kubectl port-forward command to forward the Kibana pod’s 5601 port to your local machine.
After that, use curl to send a request or the web browser to access the UI.
$ curl http://localhost:5601
Now that we have a Kibana pod running, let’s move on to fluent-bit.
Deploy Fluent-bit as Daemonset
Since Fluent-bit must stream logs from every node in the clusters, it is set up as a daemonset. A DaemonSet is a type of Kubernetes resource that ensures that a specified pod is running on each node in the cluster.
Creating the Fluent-bit Service Account
A Service Account is a Kubernetes resource that allows you to control access to the Kubernetes API for a set of pods, which determines what the pods are allowed to do. You can attach roles and role bindings to the service account, to give it specific permissions to access the Kubernetes API, this is done through Kubernetes Role and Rolebinding resources.
Let’s create a Service Account for Fluent-bit.
This file contains hidden or bidirectional Unicode text that may be interpreted or compiled differently than what appears below. To review, open the file in an editor that reveals hidden Unicode characters.
Learn more about bidirectional Unicode characters
ClusterRole to grant the get, list, and watch permissions to fluent-bit Service Account on the Kubernetes resources like the nodes, pods and namespaces objects.
Let’s create a ClusterRole for Fluent-bit.
This file contains hidden or bidirectional Unicode text that may be interpreted or compiled differently than what appears below. To review, open the file in an editor that reveals hidden Unicode characters.
Learn more about bidirectional Unicode characters
ClusterRoleBinding to bind this ClusterRole to the “fluent-bit-sa” Service Account, which will give that ServiceAccount the permissions defined in the ClusterRole.
Let’s create a Role Binding for Fluent-bit.
This file contains hidden or bidirectional Unicode text that may be interpreted or compiled differently than what appears below. To review, open the file in an editor that reveals hidden Unicode characters.
Learn more about bidirectional Unicode characters
This ConfigMap is used to configure a Fluent-bit pod, by specifying the ConfigMap field in the pod definition. This way when the pod starts it will use the configurations defined in the configmap. ConfigMap can be updates and changes, it will reflect in the pod without the need to recreate the pod itself.
Let’s create a ConfigMap for Fluent-bit.
This file contains hidden or bidirectional Unicode text that may be interpreted or compiled differently than what appears below. To review, open the file in an editor that reveals hidden Unicode characters.
Learn more about bidirectional Unicode characters
The configuration in this manifest file specifies several different sections, including:
[SERVICE]: in which we specify the flush time and log level of the service.
[INPUT]: in which we specify the input plugin that Fluent-bit should use to collect log data. In this case, the plugin is “tail”, which is used to collect logs from the files at the specified path, here is “/var/log/containers/*.log”
[FILTER]: in which we specify the filter plugin that Fluent-bit should use to process the log data. Here is “kubernetes” which is used to parse Kubernetes-specific metadata from the log lines.
[OUTPUT]: in which we specify the output plugin that Fluent-bit should use to send log data to Elasticsearch. It also includes the Elasticsearch endpoint host and port, along with other configurations.
[PARSER] in which we specify the format of the log data and how it should be parsed.
Creating the Fluent-bit Daemonset
The Fluent-bit Daemonset will automatically start collecting logs from all the nodes and send them to Elasticsearch.
Let’s create a Daemonset for Fluent-bit.
This file contains hidden or bidirectional Unicode text that may be interpreted or compiled differently than what appears below. To review, open the file in an editor that reveals hidden Unicode characters.
Learn more about bidirectional Unicode characters
By creating a pod that generates logs continuously, you can ensure that Fluent-bit is correctly collecting and forwarding the logs to Elasticsearch.
You can create a pod that generates logs continuously by using an image that has a script or a program that generates logs. For example, you can use the busybox image and run the logger command in a loop inside the pod.
Let’s create a test pod for Fluent-bit.
This file contains hidden or bidirectional Unicode text that may be interpreted or compiled differently than what appears below. To review, open the file in an editor that reveals hidden Unicode characters.
Learn more about bidirectional Unicode characters
By doing this, you are able to verify that Fluent-bit is working as expected, and it is collecting and forwarding the logs to Elasticsearch, where they can be analyzed and visualized in Kibana.
That’s it!
Hope you found this tutorial helpful, And that you will be able to set up the EFK stack for logging in Kubernetes with ease.