What is SonarQube ?
In simple words, SonarQube is an open-source tool for continuous inspection of code quality. It does static code analysis, provides a detailed report of bugs, code smells, vulnerabilities and code duplications.
SonarQube integration with Azure DevOps
We can utilize built-in Azure DevOps tasks for SonarQube which helps us to incorporate this tool into our CI/CD pipelines. We will learn that with a use case.
Lets begin 🙂
Step 1: Launch a windows virtual machine. (I used Azure for launching the machine, you can use your favorite cloud provider)
Step 2: Install SonarQube into the machine. Here we have two options:
- Either we can install sonarqube on our own machine.
- Or you can also utilize public sonarqube hosted solution which is sonarcloud
I am following the 1st option.
Step 3: Download Sonarqube community edition zip file from the following link:
Step 4: Once the file is downloaded and extracted, navigate to the below directory and run StartSonar.bat file.
C:\sonarqube\bin\windows-x86-64\StartSonar.bat
Note: Jdk 11 need to be installed in the machine before launching the StartSonar.bat file.
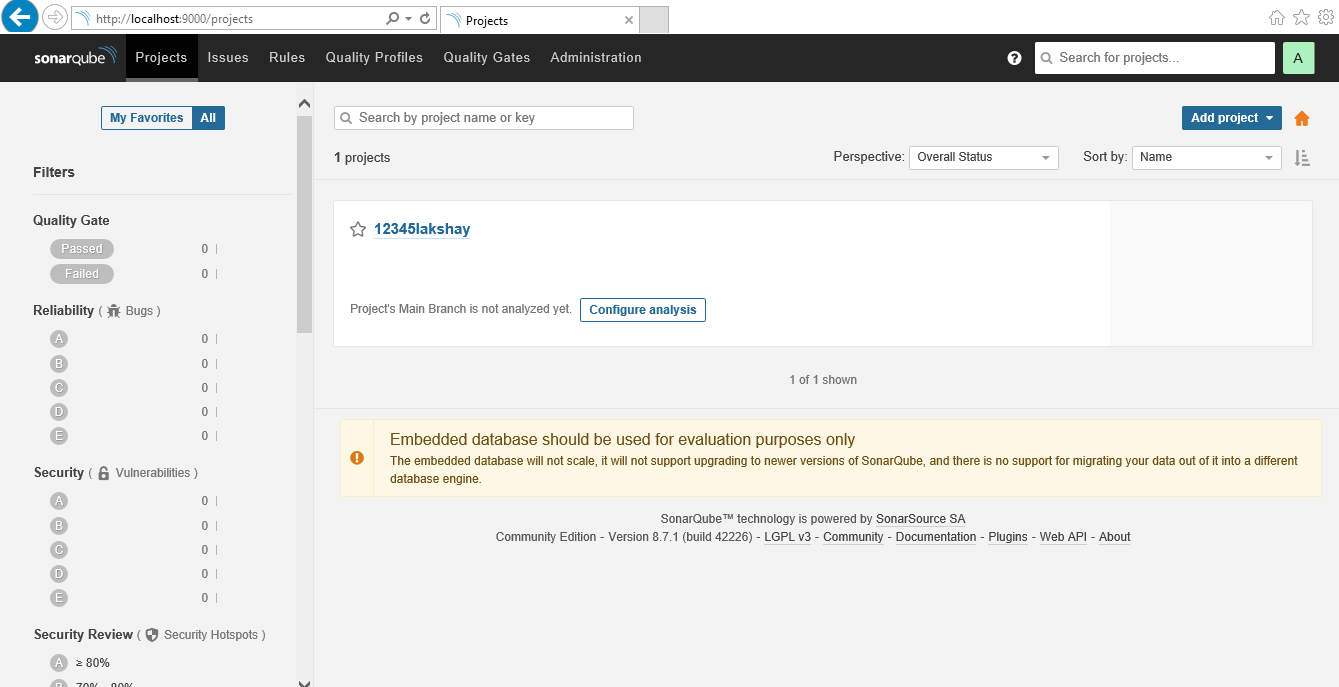
Step 5: Once the above step is done, hit the URL: http://localhost:9000/ and you should be able to see the dashboard.
Step 6: Now, we need to open port 9000 (which is by default) of our virtual machine so that Azure DevOps agent can reach out to this machine and able to establish connection.
Also, by opening this port, you will be able to access the SonarQube dashboard using the public IP of your machine in which you installed SonarQube.
http:<public IP of the machine>:9000
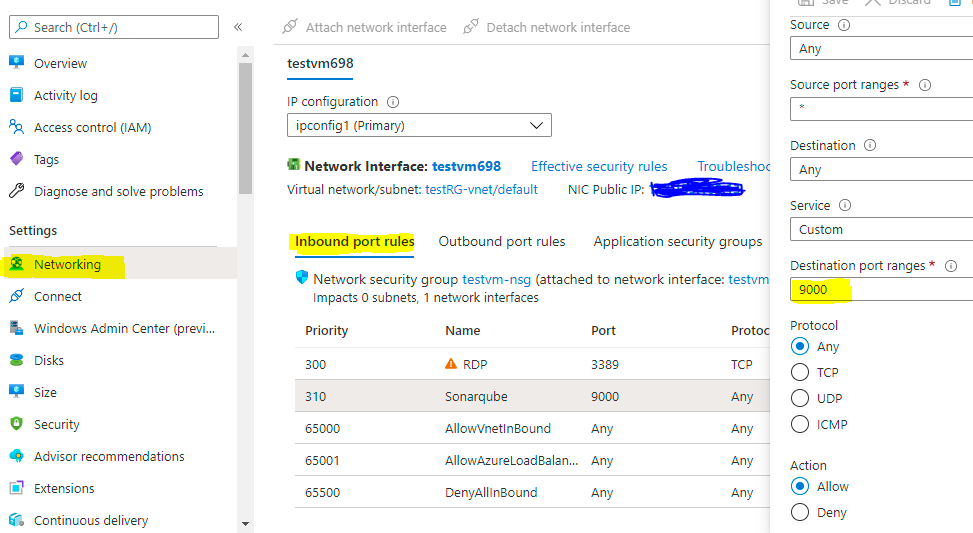
Step 7: Steps to open port in the machine:
Go to Networking–> Select Inbound Rule–> Click Add Inbound Rule–> Fill in the details (take help from below snapshot)
Hit the URL http:<public IP of the machine>:9000 and you should be able to see the dashboard in your browser.
Note: In case you are using any machine on AWS or any other cloud provider, steps may differ.
Step 8: Now we have everything in place. We can start building our CI pipeline.
Step 9: Go to your Azure DevOps project and take an empty job. We will add sonarQube tasks in pipeline in the next step.
Also, here I have used Maven POM.xml file as source code in my Azure Repos. You can take your own and move ahead with that. Else, you can also take .NET C# code. In that case, there will be a minor change in the pipeline configuration which I will tell in future steps.
Step 10: Let us start building the CI pipeline.
- Add Prepare analysis on SonarQube task in the pipeline. This task configures required settings before executing the build. It is a kind of initialization of sonarqube in the pipeline.
Following details need to be passed in this task:
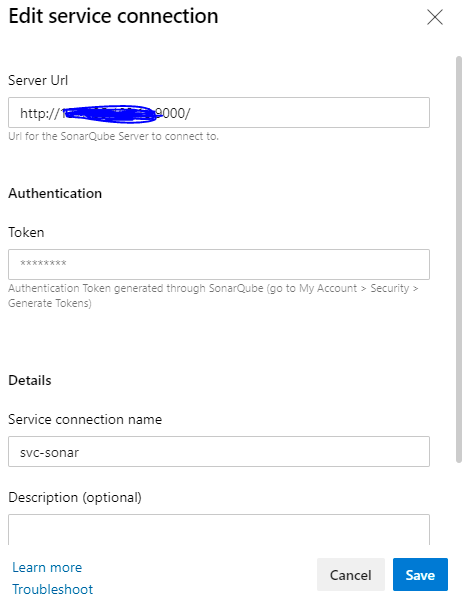
Sonarqube server endpoint: This is a service connection which you need to create between Azure DevOps agent and sonarqube. You need to pass server URL (http://<public ip of virtual machine>:9000/) and authentication token. (go to My Account > Security > Generate Tokens in sonarqube dashboard)
Choose the way to run the analysis: I have taken ‘Integrate with Maven or Gradle’.
In case you have C# code, you can choose ‘Integrate with MS Build’ option.
Leave rest of the fields to default.
- Add Maven POM.xml task in the pipeline. Again, since my code is a POM.xml file, so I have used this task. You can choose the task depending on your code.
Following details need to be passed in this task:
Goal: Maven has its own build lifecycle to deploy and distribute the target project. Each phase is a sequence of goals, and each goal is responsible for a specific task. I have used ‘test’ goal.
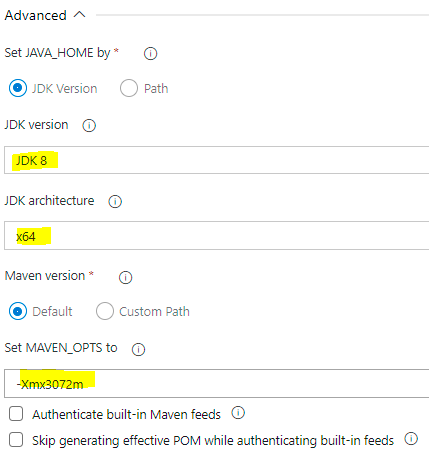
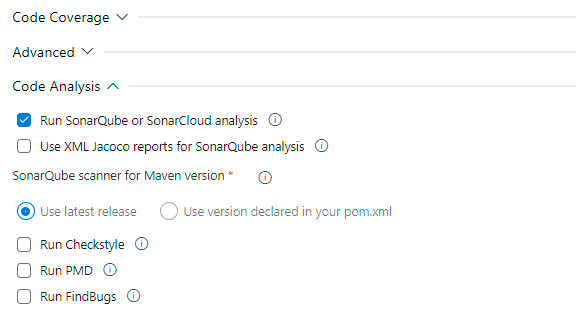
Configure advanced options section as per below snippet.
In code analysis section, tick mark Run SonarQube or SonarCloud analysis
- Add Run Code Analysis in the pipeline. This task executes the analysis of source code.
Leave the fields to default.
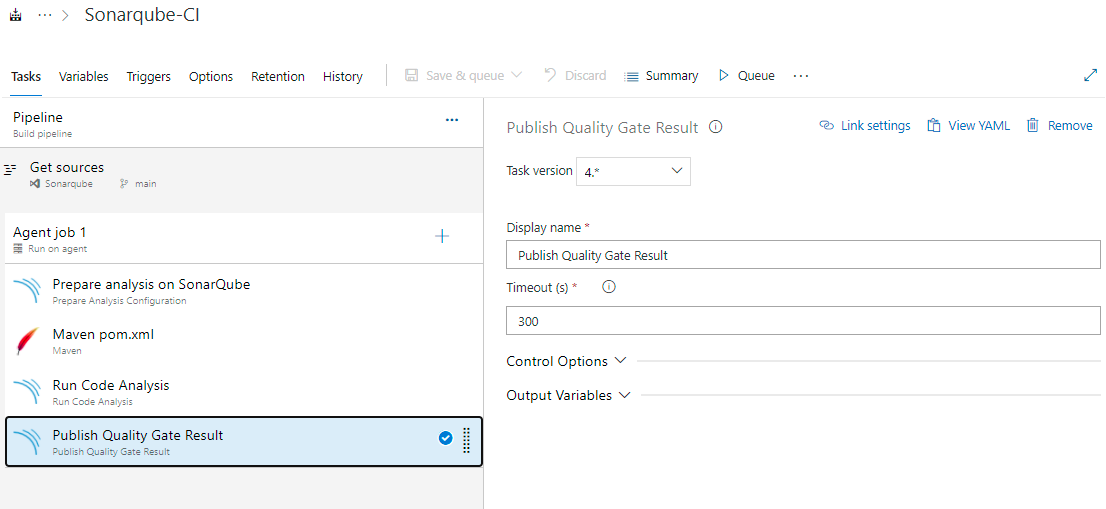
- Add Publish Gate Quality Result task in the pipeline. This task publishes the scan result as summary in build results page. This step is optional.
Leave the fields to default.
Finally, your pipeline will look like this:
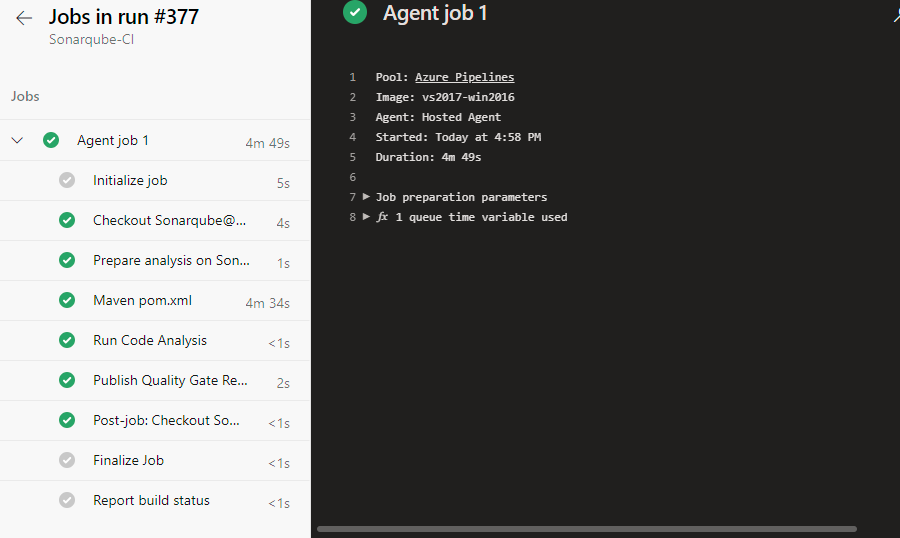
Step 11: Trigger your pipeline and once it succeeds, you should be able to see the full code scan report in sonarqube.
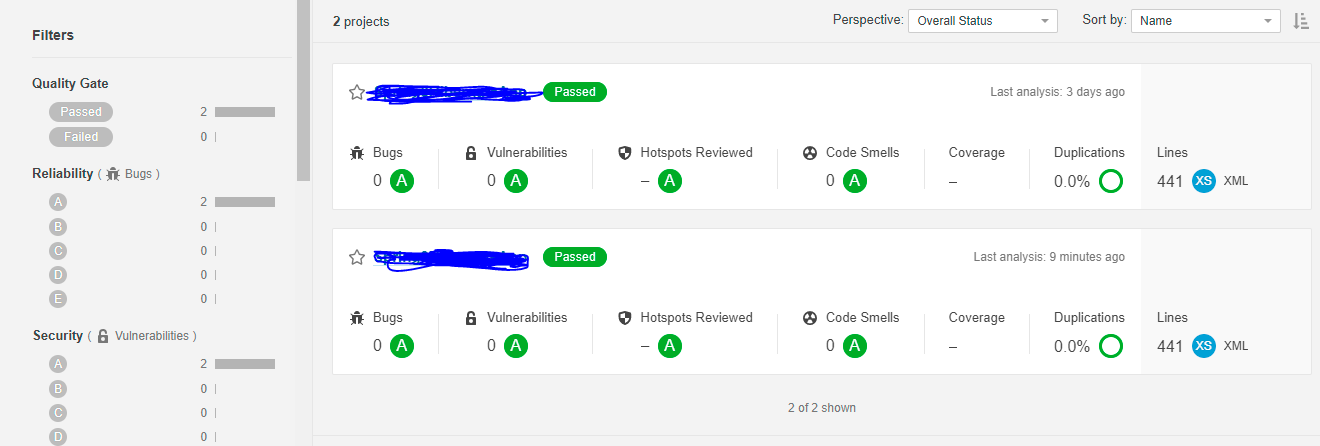
So, we have now learnt how we can use sonarqube tasks in Azure DevOps pipelines and check our code quality.
Also, if you want, you can try executing the above pipeline using YAML instead of the classic editor.
Let me know in comments in case you have any issues. Suggestions from your side will be appreciated.
Opstree is an End to End DevOps solution provider