Our Team hosted a Workshop on Prometheus which was very insightful and made absolute sense in terms of the Principles and the application part. The audience strength was pretty amazing, besides this, we also received many queries from the people who couldn’t join because of the Virtual Meet Limit. So, we shared the recording and the slides on social platforms. Here we try to share a glimpse of the workshop while keeping the same essence.
Why Monitoring?
In today’s time, organizations can’t afford one second of downtime or slow performance of their applications. But, system malfunction can happen anytime and we won’t be able to monitor the complete system for 24×7. To ensure apps are available, performant and secure at all times, engineers rely on the different types of data generated by their applications and the infrastructure supporting them, be it event logs or metrics, or both which enables monitoring of these systems and the identification and resolution of issues.
What is Monitoring?
Monitoring is the process of collecting, aggregating, and analysing those values that help to improve awareness of components, characteristics and behaviour. And, a key advantage of using the monitoring system is that on the basis of historical data, we can predict what system-level changes are needed to be done.
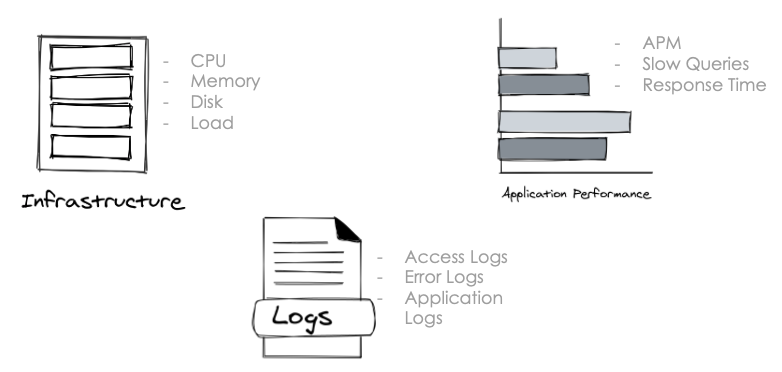
What do we Monitor?
Prometheus
Prometheus is an open-source system monitoring and alerting toolkit originally built at SoundCloud. Prometheus is a time-series database that scrapes the metrics from the HTTP/HTTPS endpoint. Prometheus provides native support to some services which means that they don’t require any kind of monitoring agent, for example:- Kubernetes, ETCD, SkyDNS.
Features:
- It’s a time-series database, so we can easily take incremental backup of our monitoring data.
- A flexible query language in form of PromQL for time series data aggregation and prediction.
- Service Discovery feature is offered in Prometheus. By using this feature we don’t have to define static targets in configuration.
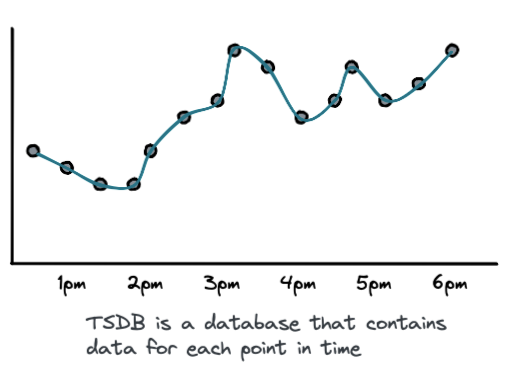
What is TSD?
Time-series data is a sequence of data points collected over time intervals, giving us the ability to track changes over time. Time-series data can track changes over milliseconds, days, or even years. And, a time-series database lets you store large volumes of timestamped data in a format that allows fast insertion and fast retrieval to support complex analysis on that data.
Prometheus Architecture
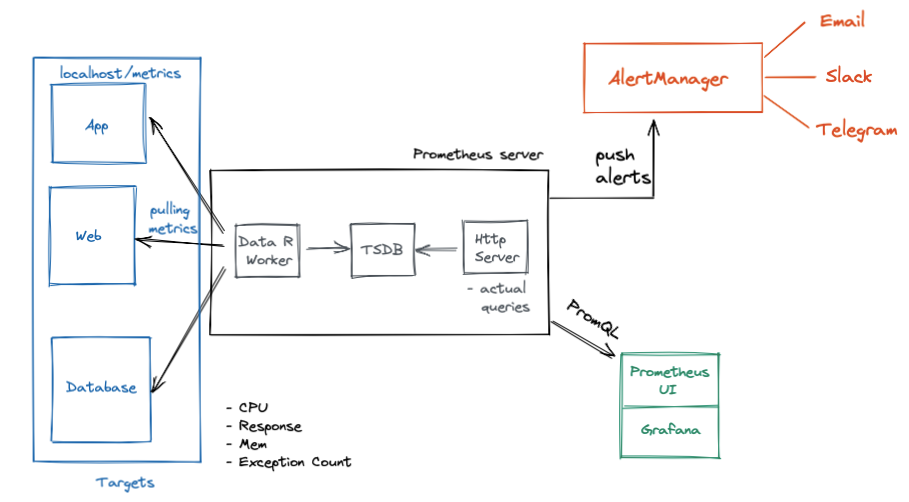
- Prometheus Server which does the actual monitoring work, consists of three components. A Data retrieval worker that scrapes the data from the target endpoints, a TSDB which stores all the collected data metrics and an HTTP server.
- Prometheus pulls the metric data from the target from an
HTTPendpoint which by default is thehostaddress/metrics, for that to work one target must expose that metric endpoint with data available and should be in time series format.
Pull and Push Model(PushGateway)
Prometheus uses a Pull model (also called Scraping) to collect metrics, meaning the Prometheus server will reach out to specified services by calling their configured HTTP endpoint to pull those metrics.
For example, in the configuration defined in prometheus.yml file tells the Prometheus servers to fetch metrics every 15s on the specified endpoint.
scrape_configs:
- job_name: 'Node_exporter'
  scrape_interval: 15s
  static_configs:
    - targets: ["localhost:9100"]
Scraping is good for long-running services since those services will be available for a long time for the Prometheus servers to make a request and collect their metrics. But for short-lived services such as Batch/Cron Jobs, by the time Prometheus decides to collect metrics, those jobs might long be terminated.
For these kinds of use cases, PushGateway comes into the picture which exists to allow ephemeral and batch jobs to expose their metrics to Prometheus.
So it’s an intermediary service, where the clients (jobs) can push their metrics as desired before it shuts down and later Prometheus can scrape those metrics from PushGateway as usual.
The Pushgateway is explicitly not an aggregator or distributed counter but rather a metrics cache.

Exporters
Exporters are kind of monitoring agent for Prometheus which fetches the data from different system and software and converts them into Prometheus time-series format and exposes metrics endpoint.

PromQL
PromQL is a Prometheus language for creating and executing queries to extract or aggregate data in Prometheus. It uses Prometheus’s Key Value based data representation and returns the value. Some examples of Prometheus vectors are:-
- Range Vector – To calculate the values in Prometheus for a period of time.
- Instant Vector – It will give the data output for the last time interval.
AlertManager
AlertManager is used to handle alerts for client applications(like Prometheus). It also takes care of alerts deduplicating, grouping and then routes them to different receivers such as E-mail, Slack, Pagerduty. Prometheus AlertManager can be setup as an individual component as well and can be used to send notifications to different mediums by Webhook trigger.

Service Discovery
It’s hard to update the configuration file each time if we have a large infrastructure. To overcome this, Prometheus supports the service discovery feature. In Prometheus service discovery, the machine or agents will automatically get registered to be monitored. No service restart is required in the case of new monitoring agents. Supports with different services like:- AWS, GCP, Azure, Kubernetes, Consul, Docker, and Digitalocean.

In Conclusion
We tried to cover the in-depth explanation of why, what and how to part with Prometheus. To bring these things into immediate action and to get started, give it a try with our hands-on labs ready. We don’t end here! We’ll be coming back soon with the different application’s monitoring of real-time infrastructure with their key metrics, conditions and alerting scenarios!!
Till then Keep Monitoring 🙂
Opstree is an End to End DevOps solution provider
Connect Us