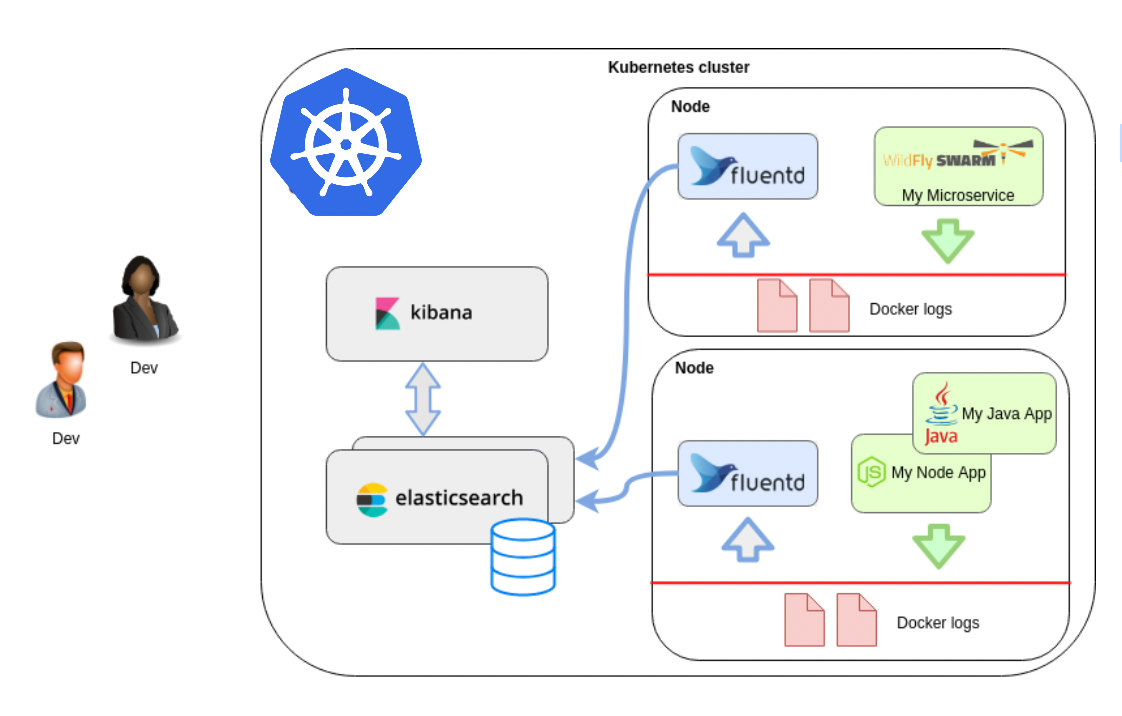
Thanks for going through part-1 of this series, if not go check out that as well here EFK 7.4.0 Stack on Kubernetes. (Part-1). In this part, we will focus on solving our Log collection problem from docker containers inside the cluster. We will do so by deploying fluentd as DaemonSet inside our k8s cluster. DaemonSet ensures that all (or some) nodes run a copy of a pod in all worker nodes of K8s cluster. Continue reading “Collect Logs with Fluentd in K8s. (Part-2)”
The Elastic Stack is the next evolution of the EFK Stack.
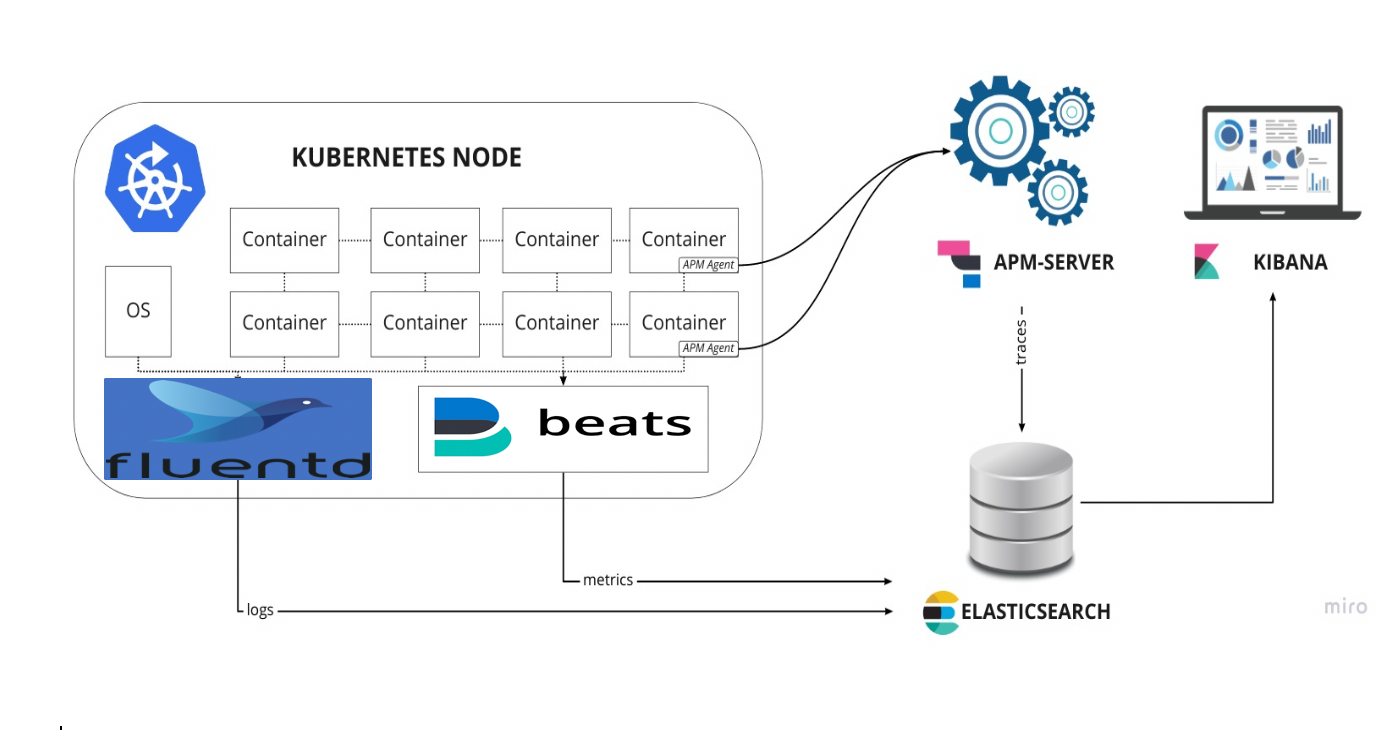
To achieve this, we will be using the EFK stack version 7.4.0 composed of Elastisearch, Fluentd, Kibana, Metricbeat, Hearbeat, APM-Server, and ElastAlert on a Kubernetes environment. This article series will walk-through a standard Kubernetes deployment, which, in my opinion, gives a overall better understanding of each step of installation and configuration.
PREREQUISITES
Before you begin with this guide, ensure you have the following available to you:
A Kubernetes 1.10+ cluster with role-based access control (RBAC) enabled
Ensure your cluster has enough resources available to roll out the EFK stack, and if not scale your cluster by adding worker nodes. We’ll be deploying a 3-Pod Elasticsearch cluster each master & data node (you can scale this down to 1 if necessary).
Every worker node will also run a Fluentd &,Metricbeat Pod.
As well as a single Pod of Kibana, Hearbeat, APM-Server & ElastAlert.
The kubectl command-line tool installed on your local machine, configured to connect to your cluster. Once you have these components set up, you’re ready to begin with this guide.
For Elasticsearch cluster to store the data, create the StorageClass in your appropriate cloud provider. If doing the on-premise deployment then use the NFS for the same.
Make sure you have applications running in your K8s Cluster to see the complete functioning of EFK Stack.
Step 1 – Creating a Namespace
Before we start deployment, we will create the namespace. Kubernetes lets you separate objects running in your cluster using a “virtual cluster” abstraction called Namespaces. In this guide, we’ll create a logging namespace into which we’ll install the EFK stack & it’s components. To create the logging Namespace, use the below yaml file.
To setup a monitoring stack first we will deploy the elasticsearch, this will act as Database to store all the data (metrics, logs and traces). The database will be composed of three scalable nodes connected together into a Cluster as recommended for production.
Here we will enable the x-pack authentication to make the stack more secure from potential attackers.
Also, we will be using the custom docker image which has elasticsearch-s3-repository-plugin installed and required certs. This will be required in future for Snapshot Lifecycle Management (SLM).
Note: Same Plugin can be used to take snapshots to AWS S3 and Alibaba OSS.
1. Build the docker image from below Docker file
FROM docker.elastic.co/elasticsearch/elasticsearch:7.4.0
USER root
ARG OSS_ACCESS_KEY_ID
ARG OSS_SECRET_ACCESS_KEY
RUN elasticsearch-plugin install --batch repository-s3
RUN elasticsearch-keystore create
RUN echo $OSS_ACCESS_KEY_ID | /usr/share/elasticsearch/bin/elasticsearch-keystore add --stdin s3.client.default.access_key
RUN echo $OSS_SECRET_ACCESS_KEY | /usr/share/elasticsearch/bin/elasticsearch-keystore add --stdin s3.client.default.secret_key
RUN elasticsearch-certutil cert -out config/elastic-certificates.p12 -pass ""
RUN chown -R elasticsearch:root config/
Now let’s build the image and push to your private container registry.
The first node of the cluster we’re going to setup is the master which is responsible of controlling the cluster.
The first k8s object, we’ll create a headless Kubernetes service called elasticsearch-master-svc.yaml that will define a DNS domain for the 3 Pods. A headless service does not perform load balancing or have a static IP.
Next, part is a StatefulSet Deployment for master node ( elasticsearch-master.yaml ) which describes the running service (docker image, number of replicas, environment variables and volumes).
#elasticsearch-master.yaml
apiVersion: apps/v1
kind: StatefulSet
metadata:
  namespace: logging
  name: elasticsearch-master
  labels:
    app: elasticsearch
    role: master
spec:
  serviceName: elasticsearch-master
  replicas: 3
  selector:
    matchLabels:
      app: elasticsearch
      role: master
  template:
    metadata:
      labels:
        app: elasticsearch
        role: master
    spec:
      affinity:
        # Try to put each ES master node on a different node in the K8s cluster
        podAntiAffinity:
          preferredDuringSchedulingIgnoredDuringExecution:
            - weight: 100
              podAffinityTerm:
                labelSelector:
                  matchExpressions:
                  - key: app
                    operator: In
                    values:
                      - elasticsearch
                  - key: role
                    operator: In
                    values:
                      - master
                topologyKey: kubernetes.io/hostname
      # spec.template.spec.initContainers
      initContainers:
        # Fix the permissions on the volume.
        - name: fix-the-volume-permission
          image: busybox
          command: ['sh', '-c', 'chown -R 1000:1000 /usr/share/elasticsearch/data']
          securityContext:
            privileged: true
          volumeMounts:
            - name: data
              mountPath: /usr/share/elasticsearch/data
        # Increase the default vm.max_map_count to 262144
        - name: increase-the-vm-max-map-count
          image: busybox
          command: ['sysctl', '-w', 'vm.max_map_count=262144']
          securityContext:
            privileged: true
        # Increase the ulimit
        - name: increase-the-ulimit
          image: busybox
          command: ['sh', '-c', 'ulimit -n 65536']
          securityContext:
            privileged: true

      # spec.template.spec.containers
      containers:
        - name: elasticsearch
          image: <registery-path>/elasticsearch-s3oss:7.4.0
          ports:
            - containerPort: 9200
              name: http
            - containerPort: 9300
              name: transport
          resources:
            requests:
              cpu: 0.25
            limits:
              cpu: 1
              memory: 1Gi
          # spec.template.spec.containers[elasticsearch].env
          env:
            - name: network.host
              value: "0.0.0.0"
            - name: discovery.seed_hosts
              value: "elasticsearch-master.logging.svc.cluster.local"
            - name: cluster.initial_master_nodes
              value: "elasticsearch-master-0,elasticsearch-master-1,elasticsearch-master-2"
            - name: ES_JAVA_OPTS
              value: -Xms512m -Xmx512m
            - name: node.master
              value: "true"
            - name: node.ingest
              value: "false"
            - name: node.data
              value: "false"
            - name: search.remote.connect
              value: "false"
            - name: cluster.name
              value: prod
            - name: node.name
              valueFrom:
                fieldRef:
                  fieldPath: metadata.name
         # parameters to enable x-pack security.
            - name: xpack.security.enabled
              value: "true"
            - name: xpack.security.transport.ssl.enabled
              value: "true"
            - name: xpack.security.transport.ssl.verification_mode
              value: "certificate"
            - name: xpack.security.transport.ssl.keystore.path
              value: elastic-certificates.p12
            - name: xpack.security.transport.ssl.truststore.path
              value: elastic-certificates.p12
          # spec.template.spec.containers[elasticsearch].volumeMounts
          volumeMounts:
            - name: data
              mountPath: /usr/share/elasticsearch/data

      # use the secret if pulling image from private repository
      imagePullSecrets:
        - name: prod-repo-sec
  # Here we are using the cloud storage class to store the data, make sure u have created the storage-class as pre-requisite.
  volumeClaimTemplates:
  - metadata:
      name: data
    spec:
      accessModes:
      - ReadWriteOnce
      storageClassName: elastic-cloud-disk
      resources:
        requests:
          storage: 20Gi
Now, apply the these files to K8s cluster to deploy elasticsearch master nodes.
The second node of the cluster we’re going to setup is the data which is responsible of hosting the data and executing the queries (CRUD, search, aggregation).
Here also, we’ll create a headless Kubernetes service called elasticsearch-data-svc.yaml that will define a DNS domain for the 3 Pods.
Next, part is a StatefulSet Deployment for data node elasticsearch-data.yaml , which describes the running service (docker image, number of replicas, environment variables and volumes).
#elasticsearch-data.yaml
apiVersion: apps/v1
kind: StatefulSet
metadata:
  namespace: logging
  name: elasticsearch-data
  labels:
    app: elasticsearch
    role: data
spec:
  serviceName: elasticsearch-data
  # This is number of nodes that we want to run
  replicas: 3
  selector:
    matchLabels:
      app: elasticsearch
      role: data
  template:
    metadata:
      labels:
        app: elasticsearch
        role: data
    spec:
      affinity:
        # Try to put each ES data node on a different node in the K8s cluster
        podAntiAffinity:
          preferredDuringSchedulingIgnoredDuringExecution:
            - weight: 100
              podAffinityTerm:
                labelSelector:
                  matchExpressions:
                  - key: app
                    operator: In
                    values:
                      - elasticsearch
                  - key: role
                    operator: In
                    values:
                      - data
                topologyKey: kubernetes.io/hostname
      terminationGracePeriodSeconds: 300
      # spec.template.spec.initContainers
      initContainers:
        # Fix the permissions on the volume.
        - name: fix-the-volume-permission
          image: busybox
          command: ['sh', '-c', 'chown -R 1000:1000 /usr/share/elasticsearch/data']
          securityContext:
            privileged: true
          volumeMounts:
            - name: data
              mountPath: /usr/share/elasticsearch/data
        # Increase the default vm.max_map_count to 262144
        - name: increase-the-vm-max-map-count
          image: busybox
          command: ['sysctl', '-w', 'vm.max_map_count=262144']
          securityContext:
            privileged: true
        # Increase the ulimit
        - name: increase-the-ulimit
          image: busybox
          command: ['sh', '-c', 'ulimit -n 65536']
          securityContext:
            privileged: true
      # spec.template.spec.containers
      containers:
        - name: elasticsearch
          image: <registery-path>/elasticsearch-s3oss:7.4.0
          imagePullPolicy: Always
          ports:
            - containerPort: 9200
              name: http
            - containerPort: 9300
              name: transport
          resources:
            limits:
              memory: 4Gi
          # spec.template.spec.containers[elasticsearch].env
          env:
            - name: discovery.seed_hosts
              value: "elasticsearch-master.logging.svc.cluster.local"
            - name: ES_JAVA_OPTS
              value: -Xms3g -Xmx3g
            - name: node.master
              value: "false"
            - name: node.ingest
              value: "true"
            - name: node.data
              value: "true"
            - name: cluster.remote.connect
              value: "true"
            - name: cluster.name
              value: prod
            - name: node.name
              valueFrom:
                fieldRef:
                  fieldPath: metadata.name
            - name: xpack.security.enabled
              value: "true"
            - name: xpack.security.transport.ssl.enabled
              value: "true"
            - name: xpack.security.transport.ssl.verification_mode
              value: "certificate"
            - name: xpack.security.transport.ssl.keystore.path
              value: elastic-certificates.p12
            - name: xpack.security.transport.ssl.truststore.path
              value: elastic-certificates.p12
          # spec.template.spec.containers[elasticsearch].volumeMounts
          volumeMounts:
            - name: data
              mountPath: /usr/share/elasticsearch/data

      # use the secret if pulling image from private repository
      imagePullSecrets:
        - name: prod-repo-sec

# Here we are using the cloud storage class to store the data, make sure u have created the storage-class as pre-requisite.
  volumeClaimTemplates:
  - metadata:
      name: data
    spec:
      accessModes:
      - ReadWriteOnce
      storageClassName: elastic-cloud-disk
      resources:
        requests:
          storage: 50Gi
Now, apply these files to K8s Cluster to deploy elasticsearch data nodes.
4. Generate a X-Pack password and store in a k8s secret:
We enabled the x-pack security module above to secure our cluster, so we need to initialize the passwords. Execute the following command which runs the program bin/elasticsearch-setup-passwords within the data node container (any node would work) to generate default users and passwords.
$ kubectl exec $(kubectl get pods -n logging | grep elasticsearch-data | sed -n 1p | awk '{print $1}') \
    -n monitoring \
    -- bin/elasticsearch-setup-passwords auto -b

Changed password for user apm_system
PASSWORD apm_system = uF8k2KVwNokmHUomemBG

Changed password for user kibana
PASSWORD kibana = DBptcLh8hu26230mIYc3

Changed password for user logstash_system
PASSWORD logstash_system = SJFKuXncpNrkuSmVCaVS

Changed password for user beats_system
PASSWORD beats_system = FGgIkQ1ki7mPPB3d7ns7

Changed password for user remote_monitoring_user
PASSWORD remote_monitoring_user = EgFB3FOsORqOx2EuZNLZ

Changed password for user elastic
PASSWORD elastic = 3JW4tPdspoUHzQsfQyAI
Note the elastic user password and we will add into a k8s secret (efk-pw-elastic) which will be used by another stack components to connect elasticsearch data nodes for data ingestion.
To launch Kibana on Kubernetes, we’ll create a configMapkibana-configmap,to provide a config file to our deployment with all the required properties, Service called kibana, and a Deployment consisting of one Pod replica. You can scale the number of replicas depending on your production needs, and Ingress which helps to routes outside traffic to Service inside the cluster. You need an Ingress controller for this step.
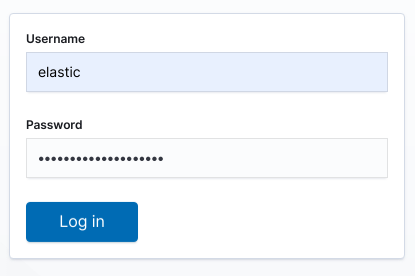
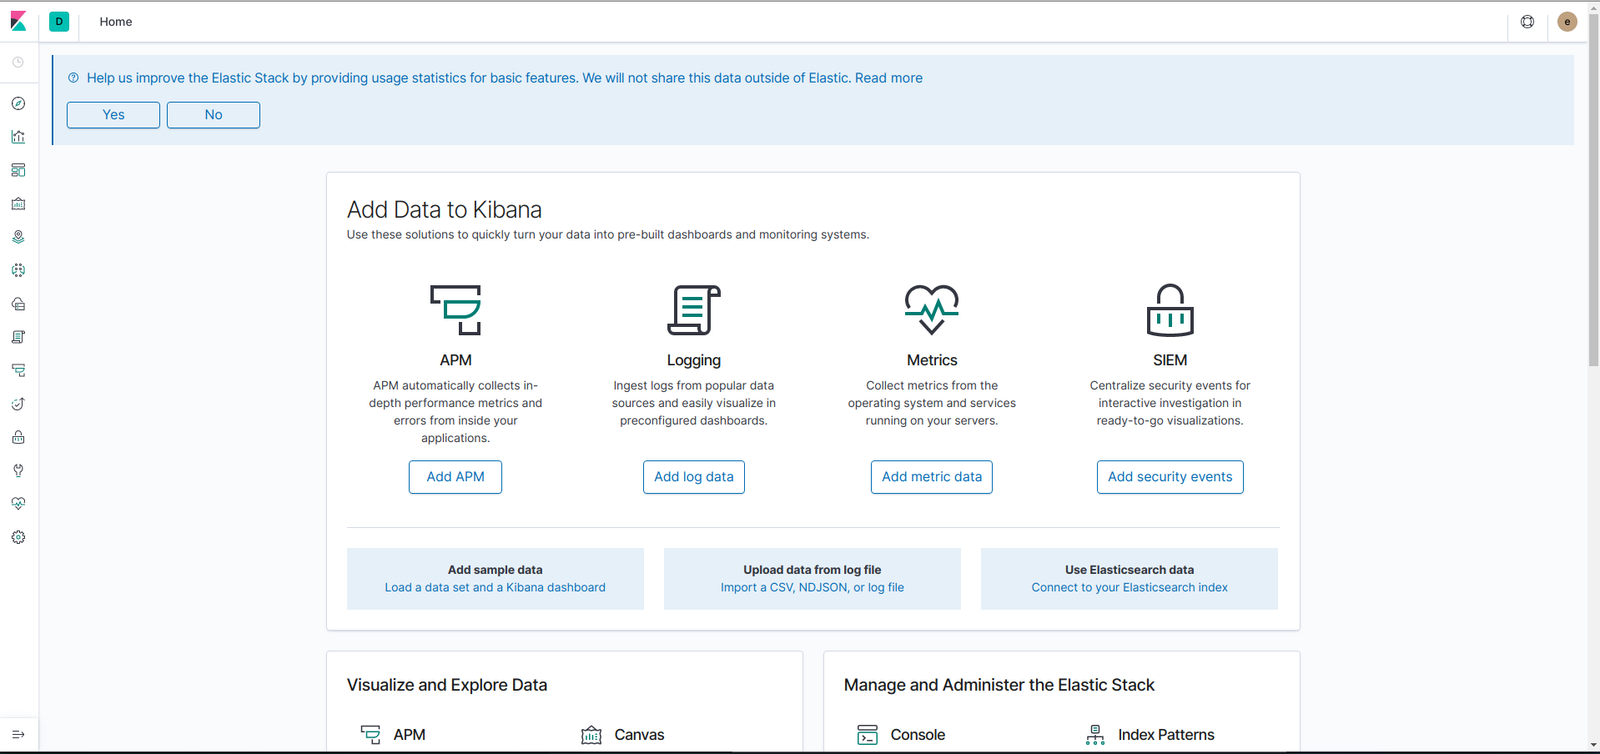
Now, Open the Kibana with the domain name in your browser, which we have defined in our Ingress or user can expose the kiban service on Node Port and access the dashboard.
Now, login with username elastic and the password generated before and stored in a secret (efk-pw-elastic) and you will be redirected to the index page:
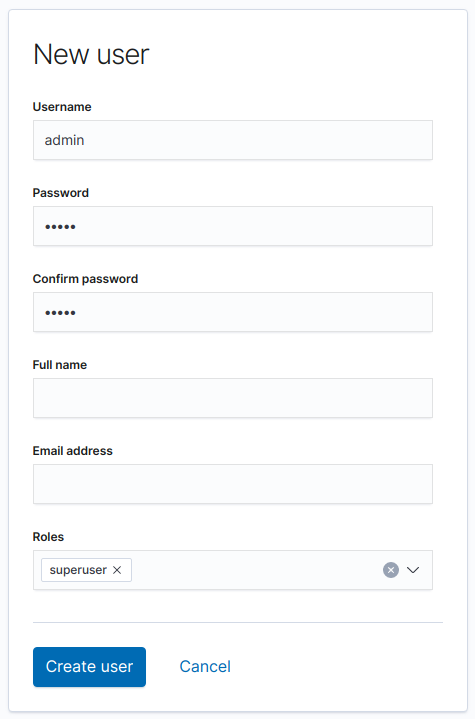
Last, create the separate admin user to access the kibana dashboard with role superuser.
Finally, we are ready to use the ElasticSearch + Kibana stack which will serve us to store and visualize our infrastructure and application data (metrics, logs and traces).
The first thing which comes in mind when I hear about logging solutions in my infrastructure is ELK (Elasticsearch, Logstash, Kibana). But, what happens when logs face an upsurge in the quantity and hamper performance, which, in Elasticsearch words, we may also call “A Fall Back” We need to get control of situation, and optimize our setup. For which, we require a need for tuning the Elasticsearch
What Is ElasticSearch?
It is a java based, open-source project build over Apache Lucene and released under the license of Apache. It has the ability to store, search and analyse document files in diverse format.
A Bit Of History
Shay Banon was the founder of compass project, thought of need to create a scalable search engine which could support other languages than java. Therefore, he started to build a whole new project which was the 3rd version of compass using JSON and HTTP interface. The first version of which was released in 2010.
ElasticSearch Cluster
Elasticsearch is a java based project which runs on Java Virtual Machines, wherein each JVM server is considered to be an elasticsearch node. In order to support scalability, elasticsearch holds up the concept of cluster in which multiple nodes runs on one or more host machines which can be grouped together into a cluster which has a unique name. These clustered nodes holds up the entire data in the form of documents and provides the functionality of indexing and search of those documents.
Types Of Nodes:-
Master Eligible-Node Masters are meant for cluster/admin operations like allocation, state maintenance, index/alias creation, etc
Data Node Data nodes hold data and perform data-related operations such as CRUD, search, and aggregations.
Ingest Node Ingest nodes are able to apply an ingest pipeline to a document in order to transform and enrich the document before indexing.
Tribe Node It is a special type of coordinating node that can connect to multiple clusters and perform search and other operations across all connected clusters.
Shards and Replicas
Shards: Further dividing index into multiple entities are called shards
Replicas: Making one or more copies of the index’s shards called as replica shards or simple replicas
By default in Elasticsearch every index is allocated with 5 primary shards and single replica of each shard. That means for every index there will be 5 primary shards and replication of each will result in total of 10 shards per index.
Types Of Tuning in ElasticSearch:-
Index Performance Tuning
Use Bulk Requests
Use multiple workers/threads to send data to Elasticsearch
Unset or increase the refresh interval
Disable refresh and replicas for initial loads
Disable swapping
Give memory to the file-system cache
Use faster hardware
Indexing buffer size ( Increase the size of the indexing buffer – JAVA Heap Size )
Search Performance Tuning
Give memory to the file-system cache
Use faster hardware
Document modeling (documents should not be joined)
Search as few fields as possible
Pre-index data (give values to your search)
Shards might help with throughput, but not always
Use index sorting to speed up conjunctions
Warm up the file-system cache (index.store.preload)
Why Is ElasticSearch Tuning Required?
Elasticsearch gives you moderate performance for search and injection of logs maintaining a balance. But when the service utilization or service count within the infrastructure grows, logs grow in similar proportion. One could easily scale the cluster vertically, but that would increase the cost. Instead, you can tune the cluster as per the requirement(Search or Injection) while maintaining the cost constrains.
Tune-up
How to handle 20k logs ingestion per sec? For such high data volume ingestion into elastic search cluster, you would be somehow compromising the search performance.Starting step is to choose the right compute system for the requirement, prefer high compute for memory over CPU. We are using m5.2xlarge(8 CPU/32 GB) as data nodes and t3.medium (2 CPU/ 4 GB) for master.
Elasticsearch Cluster Size Master – 3 (HA – To avoid the split-brain problem) or 1 (NON-HA) Data Node – 2
Configure JVM The optimal or minimal configuration for JVM heap size for the cluster is 50% of the memory of the server. File: jvm.option Path: /etc/elasticsearch/
Dynamic APIs for tuning index performance With respect to the index tuning performance parameters, below mentioned are the dynamic APIs (Zero downtime configuration update) for tuning the parameters. Updating Translog Translog is included in every shard which maintains the persistence of every log by recording every non-committed index operation. Changes that happen after one commit and before another will be lost in the event of process exit or hardware failure. To prevent this data loss, each shard has a transaction log or write-ahead log associated with it. Any index or delete operation is written to the translog after being processed by the internal Lucene index. async – In the event of hardware failure, all acknowledged writes since the last automatic commit will be discarded. Setting translog to async will increase the index write performance, but do not guarantee data recovery in case of hardware failure.
Timeout Adjust the time period of operation with respect to the number of indexes. Larger number of indexes, higher would be the timeout value. Number of Replicas to minimal In case there is a requirement of ingestion of data in large amount (same scenario as we have), we should set the replica to ‘0‘. This is risky as loss of any shard will cause a data loss as no replica set exist for it. But also at the same time index performance will significantly increase as the document has to be index just once, without replica. After you are done with the load ingestion, you can revert back the same setting.
Increase the Refresh Interval Making the indexes available for search is the operation called as refresh, and that’s a costly operation in terms of resources. Calling it too frequently can compromise the index write performance.
The Default settings for elasticsearch is to refresh the indexes every second for which the the search request is consecutive in the last 30 seconds. This is the most appropriate configuration if you have no or very little search traffic and want to optimize for indexing speed.
In case, if your index participate in frequent search requests, in this scenario Elasticsearch will refresh the index every second. If you can bear the expense to increase the amount of time between when a document gets indexed and when it becomes visible, increasing the index.refresh_interval to a grater value, e.g. 300s(5 mins), might help improve indexing performance.
Decreasing number of shards Changing the number of shards can be achieved by _shrink and _split APIs. As the name suggests, to increase the number of shards split can be used and shrink for decrease. By default in Elasticsearch every index is allocated with 5 primary shards and single replica of each shard. That means for every index there will be 5 primary shards and replication of each will result in total of 10 shards per index.
When Logstash is Input Logstash provides the following configurable options for tuning pipeline performance:
Pipeline Workers
Pipeline Batch Size
Pipeline Batch Delay
Profiling the Heap
Configuring the above parameters would help in increasing the injection rate (index performance), as the above parameters work for feeding in elasticsearch.
Summary
ElasticSearch tuning is very complex and critical task as it can give some serious damage to your cluster or break down the whole. So be careful while modifying any parameters on production environment.
ElasticSearch tuning can be extensively used to add values to the logging system, also meeting the cost constrains.