Implementing Supervisor Process Monitoring with Open Telemetry

In this blog, I’ll Walk you through how I set up a custom monitoring system for Supervisor-managed processes like Nginx and Apache2, this setup will allow you to track the health and performance of processes running under Supervisor in real time.  Continue reading “Implementing Supervisor Process Monitoring with Open Telemetry”

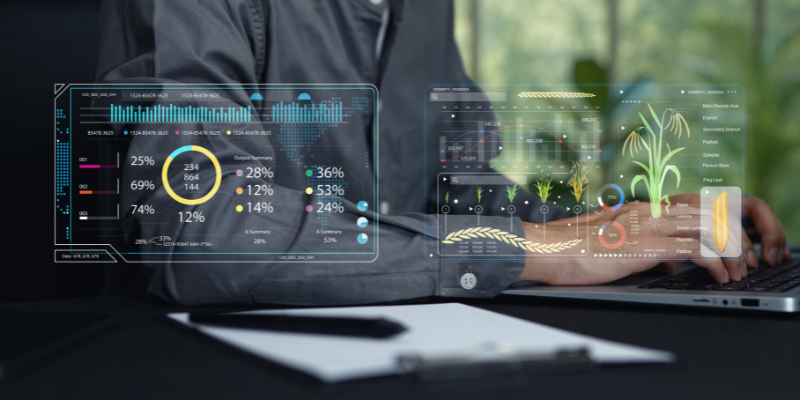
Edge AI: Running TensorFlow Models on IoT Devices

Your smart thermostat senses a temperature drop before you notice. Your camera recognizes a familiar face the second it appears. And none of it goes through the cloud. That’s the power of Edge AI with TensorFlow, where machine learning runs locally on IoT devices, making them faster, more private, and incredibly efficient. 

In this blog, we’ll explore how TensorFlow Lite models are optimized for edge hardware, the challenges of deploying lightweight AI models on embedded systems, and the benefits of real-time AI inference at the edge for smart devices. 

Continue reading “Edge AI: Running TensorFlow Models on IoT Devices”

How to Monitor Open Telemetry Collector Performance: A Complete, Production -Grade Guide

In modern distributed systems, observability is not a luxury—it’s a necessity. At the center of this landscape stands the Open Telemetry Collector, acting as the critical data pipeline responsible for receiving, processing, and exporting telemetry signals (traces, metrics, logs). 

However, monitoring the monitor itself presents unique challenges. When your OpenTelemetry Collector becomes a bottleneck or fails silently, your entire observability stack suffers. This comprehensive guide will walk you through production-tested strategies for monitoring your OpenTelemetry Collector’s performance, ensuring your observability infrastructure remains robust and reliable. 

Continue reading “How to Monitor Open Telemetry Collector Performance: A Complete, Production -Grade Guide”

Cloud Performance Monitoring – A Complete Setup Using ELK Stack

Is your cloud infrastructure running smoothly, or are hidden bottlenecks slowing you down? In this digital orbit, even a minor lag can cost you users and revenue. But what if you could monitor, analyze, and optimize performance in real-time? 

That’s where the ELK Stack (Elasticsearch, Logstash, Kibana), a powerhouse trio that transforms raw cloud data into actionable insights comes in. Whether you’re troubleshooting latency or predicting outages, this complete setup guide will walk you through everything you need to master cloud performance monitoring. 

Continue reading “Cloud Performance Monitoring – A Complete Setup Using ELK Stack”

Redis Observability with Open Telemetry

Redis is a cornerstone of many modern applications, valued for its high speed and flexibility. However, Redis systems are not “set-and-forget.” Maintaining operational excellence requires careful monitoring of critical metrics to detect early signs of performance degradation, resource exhaustion, or failures. 

In this blog, we learn how to monitor Redis directly using Open Telemetry Collector’s Redis receiver, without relying on a separate Redis Exporter. 

Continue reading “Redis Observability with Open Telemetry”