Introduction
Resources are the basal element of chef’s heap. In all the functioning of chef, resources are in crux. These are a very first statement of any chef recipe or cookbook. In this blog we only intensify on the practical approach of working with resources. This article will help you to compose a primitive awareness towards the execution of chef.
“Pie Makes Everybody Happy!! L. H. Anderson”
Prerequisites
To follow this article you need a prior information about Git and Vagrant. This blog uses centos7 as platform.
Getting Started
Sooner, probably but it necessitous to talk about chef installation. For this and some of next blogs we use chef-standalone mode. Chef-standalone mode provides a basic learning environment for beginners. Chef-standalone mode allow you to configure a machine directly.
Chef cater a complete package labeled as Chefdk (Chef Development Kit ). It encloses all the essential thing you need to start with chef.

Install Chefdk
Clone our git repo and spin up a vagrant box with it.
$ git clone git@github.com:OpsTree/Chef.git
-
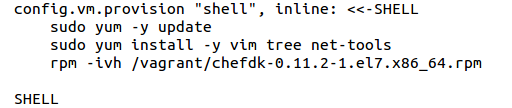
Go to chefResources directory. This directory contains a Vagrantfile, which can launch a centos7 vagrant machine with Chefdk and other essential tools installed.
$ cat Vagrantfile
-
Launch a new vagrant machine and login into it.
$ vagrant up
$ vagrant ssh
Your learning environment is ready. Let’s start with chef resources.
Resource
Lets took our first resource package. As in our blog series we go through a common problem statement of installing nginx and then setup nginx vhost. This time we are going to do this with chef resources only. Chef resource have basic two parts properties and action. We will discuss both of these in our next article. Till then we start playing with chef resources.
-
Package resource
Package resource is used to manage packages. This is the base resource for other package management resources for different platforms.
-
-
Add nginx repo by installing epel-release.
-
$ sudo chef-apply -l info -e “package ‘epel-release'”
-
-
Install nginx using package resource
-
$ sudo chef-apply -l info -e “package ‘nginx'”
-
Directory resource
Directory resource is responsible to maintain the directory lane in target node.This resource have multiple attributes to classify the permissions, owner and group.
-
-
Create home directory for vhosts.
-
$ sudo chef-apply -l info -e “directory ‘/usr/share/nginx/blog'”
$ sudo chef-apply -l info -e “directory ‘/usr/share/nginx/chef'”
This will create two directories blog and chef under ‘/usr/share/nginx directory’.
-
File resource
This resource is answerable for the file management on the node. This resource holds mode, content, owner, group and path attributes with their respective meaning for a file.
-
-
Create index files for nginx vhosts.
-
$ sudo chef-apply -l info -e “file ‘/usr/share/nginx/blog/index.html’ do content ‘Hello from blog server’ end”
$ sudo chef-apply -l info -e “file ‘/usr/share/nginx/chef/index.html’ do content ‘Hello from chef server’ end”
File resource creates a index.html file under chef and blog directories with the respective content available in resource.
-
-
Create opstree.com/blog/.conf and chef.opstree.com.conf into the /etc/nginx/conf.d directory with files available for this.
-
$ sudo chef-apply -l info -e “file ‘/etc/nginx/conf.d/opstree.com/blog/.conf’ do content IO.read(‘/vagrant/resources/opstree.com/blog/.conf’) end”
$ sudo chef-apply -l info -e “file ‘/etc/nginx/conf.d/chef.opstree.com.conf’ do content IO.read(‘/vagrant/resources/chef.opstree.com.conf’) end”
This file resource creates vhost configuration files for opstree.com/blog/ and chef.opstree.com. This time file resource uses a ruby function IO.read to read the content of a sample file and paste them into target file.
-
Make entry in /etc/hosts
-
This is possible to make these entry with chef but it is a little complex for this time as we are not so proficient with chef. So we are doing this manually for now, but in our next article we will do this with chef.
-
$ sudo vim /etc/hosts
127.0.0.1 opstree.com/blog/
127.0.0.1 chef.opstree.com
-
Service resource
Service resource is used to manage services. Use this resource to restart the nginx service.
-
-
Restart your nginx server to make changes effective.
-
$ sudo chef-apply -e “service ‘nginx’ do action [:stop, :start] end”
This resource has two defied actions ie. stop and start which run in defined order to stop and then start nginx. You can use restart action of service resource but it is a good habit to use stop and start.
You can find all these resources in our git repo under “Chef/centos/chefResources/resources” directory. Just run the all “.sh” files to run our resources.
So now you start sensing the power of chef and also aware with the basics of resources. We will next come up with the theory behind the resources and some new exciting examples in our blog.
“The Good NEWS Is You’re The Pilot. Michael Altshuler”
So stay great as Chef.