
Step to Resolve Timeout Issues in Python Django on Kubernetes
Even after adjusting configurations and scaling our application, the problem persisted, leading us to delve deeper into the underlying infrastructure. Here are the steps that we followed to identify and fix the issues:
Fine-Tuning Kubernetes Resource Allocation: We looked at our resource allocation for the application and checked it against the minimum requirement for the application to run.
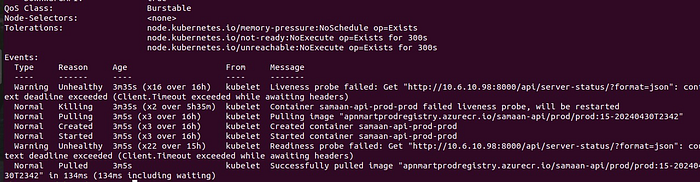
Readiness & Liveness Probe: Initially, we optimized resource usage. Then, we extended the liveness and readiness timeout to ensure that the probe responded back before the timeout exceeded.
Research on Stack Overflow highlighted that under heavy request loads, the probes might struggle to respond promptly.
Therefore, we increased the probe timeout. This adjustment significantly reduced the frequency of timeout issues in our application. Moreover, by doubling the timeout setting, we observed a 25% decrease in application timeouts.
Gunicorn Configuration: Even after doubling the time for the liveness and readiness checks, the problem’s still there. So, we added Gunicorn to our Django app. It uses workers better to manage more requests, helping avoid server issues beyond what the checks fix. This makes things smoother and prevents timeouts.
Number of Worker = (2 * #cores) + 1 WorkerClass: gthread
Changing Gunicorn worker class and number of threads: Even though we set up Gunicorn with the usual settings and made the liveness and readiness checks take longer, the problem stayed.
So, we discussed with our Python developer and decided to switch Gunicorn’s worker class to “gevents”. This change helped it handle lots of requests all at once without causing problems.
Upgrading the Postgres Master Server Configuration: After making all the changes to the application, we checked how much the PostgreSQL master was using the node’s resources.
We saw that the CPU was getting really busy, which could be causing the timeouts. So, we decided to increase the node size for the PostgreSQL master. But even after doing that, the problem still persisted.

Setting up monitoring for Postgres and Ingress Controller: Even after making many changes, we still had the same problem with our app. So, we decided to monitor the Nginx ingress controller and our Postgres Database using Postgres exporter. So when we started monitoring the ingress controller & Postgres database, we noticed that when there were too many requests at the same time Postgres tables were also getting locked.
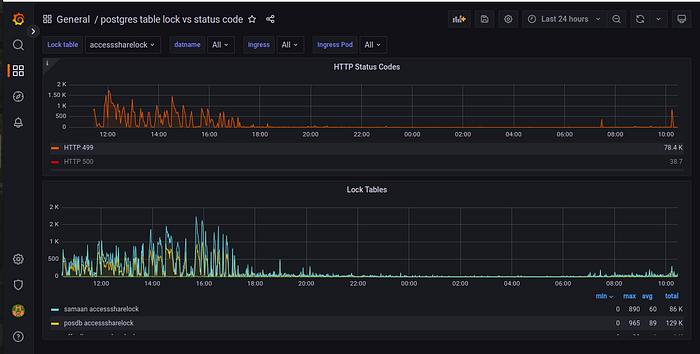
So after implementing monitoring, we noticed that when the application times out, the database tables also get locked.
Based on this analysis, we can conclude that the database lock is causing a timeout issue and an increase in HTTP status code 499 errors, which usually means that the client closed the connection before receiving a response.
Conclusion:
Fixing our app’s slowdowns needed patience, know-how, and the right tools. Keeping a close eye on our system and using tools that help us see what’s going on, we found out why our app was timing out.
It turns out, that our database was getting stuck sometimes, slowing everything down. After fixing that, our app is now running smoothly in Kubernetes, without any issues.
Currently, we are further optimizing our application by introducing Celery to manage the exponential traffic growth. We’ll share the solution for the issue in the upcoming second part of our blog.
Connect Us