
Redis is a cornerstone of many modern applications, valued for its high speed and flexibility. However, Redis systems are not “set-and-forget.” Maintaining operational excellence requires careful monitoring of critical metrics to detect early signs of performance degradation, resource exhaustion, or failures.
In this blog, we learn how to monitor Redis directly using Open Telemetry Collector’s Redis receiver, without relying on a separate Redis Exporter.
Why Monitor Redis?
Redis can face issues like:
- High memory usage
- Slow client responses
- Key evictions due to memory limits
- High CPU load
- Replication lag
Why Not Redis Exporter? (The Bottleneck)
| Issue with Redis Exporter | Explanation |
| Extra Container Dependency | Required a separate exporter container or sidecar to run alongside Redis |
| Overhead | Added operational and resource overhead in managing the exporter |
| Format Translation | Redis Exporter exposed metrics in Prometheus format, needing separate handling |
| Limited Integration | Could not directly benefit from OpenTelemetry’s native features |
| No Unified Pipeline | Logs, metrics, and traces had to be handled in different ways |
Why Switch to OpenTelemetry?
- Simplifies architecture by removing the need for Redis Exporter
- Native metrics collection from Redis using the Redis protocol
- Unified telemetry pipeline for metrics, logs, and traces
- Better integration with tools like VictoriaMetrics and Grafana
What is Open Telemetry?
Open Telemetry is an open-source framework that collects telemetry data — metrics, logs, and traces — in a standard format. It helps you monitor services like Redis in a consistent and scalable way.
Setup Overview (Without Redis Exporter)
We will use:
- Redis Server — The target service to be monitored
- OpenTelemetry Collector — To pull Redis metrics via Redis receiver
- VictoriaMetrics / Prometheus — Stores the time-series metrics
- Grafana — To visualize metrics
OpenTelemetry Collector Configuration
receivers:
  redis:
    endpoint: "localhost:6379"
    password: " "   # Optional: use if Redis requires auth
    collection_interval: 10s
How it works:
- OpenTelemetry pulls metrics directly from Redis using its native protocol
- The metrics are pushed to VictoriaMetrics
- You can then query and visualize those metrics in Grafana
Important Redis Metrics Collected:
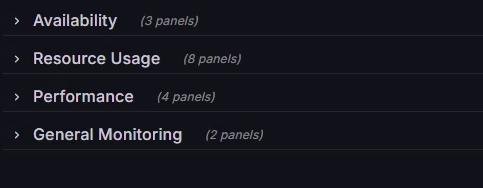
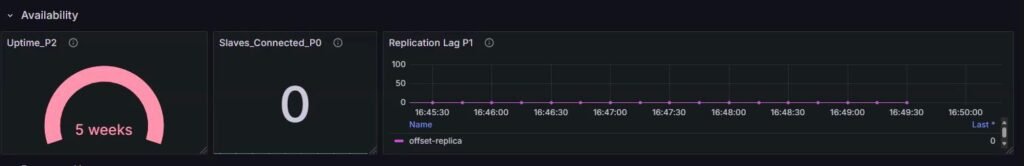
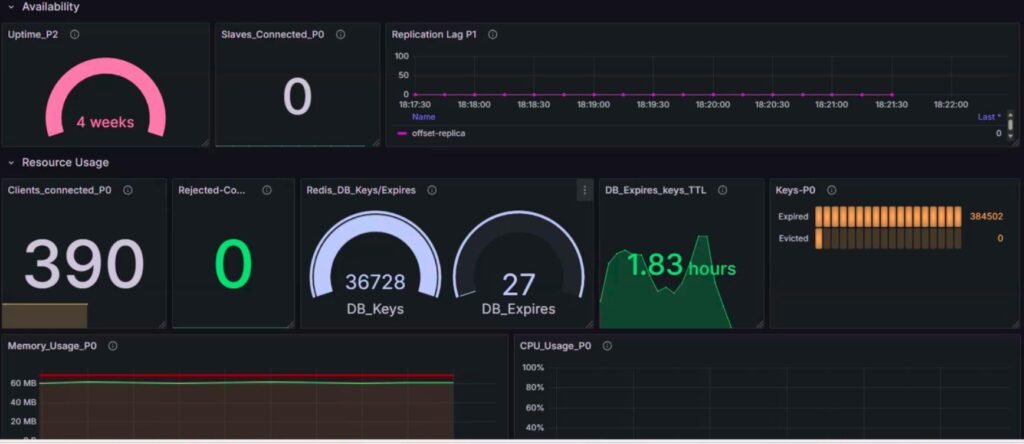
1. Availability:
| Metric | Description | Significance |
|---|---|---|
| redis_uptime_seconds_total | Total uptime since Redis started | Frequent restarts indicate instability |
| redis_replication_offset_bytes | Current replication offset | Helps check if replicas are lagging |
| redis_slaves_connected | Number of connected replicas | Ensures HA replication is working |
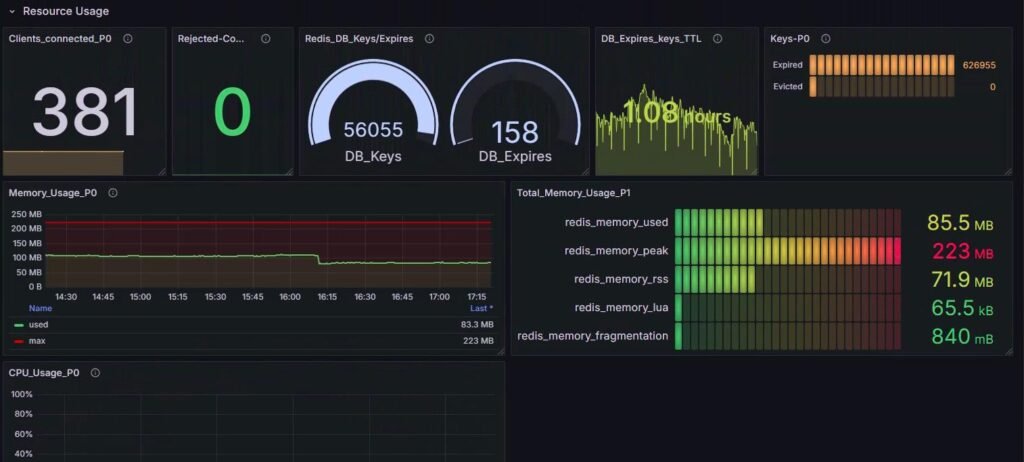
2. Resource Usage:
a) Client Metrics:
Monitoring client activity is crucial to ensure Redis can handle the expected load without becoming overwhelmed.
| Metric | Description | Significance |
|---|---|---|
| redis_clients_connected | Active client connections | Detects overload or unusual client growth |
| redis_clients_max_input_buffer_bytes | Max input buffer size | Large buffers may mean slow clients |
| redis_clients_max_output_buffer_bytes | Max output buffer size | May indicate slow consumers or network issues |
b) Connection Metrics:
| Metric | Description | Significance |
|---|---|---|
| redis_connections_received_total | Total accepted connections | Sudden surges may indicate retries or attacks |
| redis_connections_rejected_total | Rejected connections (max clients reached) | Indicates scaling needs or max clients tuning |
c) CPU Metrics:
Redis is CPU-intensive by nature; tracking CPU usage helps ensure smooth performance.
| Metric | Description | Significance |
|---|---|---|
| redis_cpu_time_seconds_total | CPU time used by Redis | Spikes may suggest slow clients or poor queries |
d) Database Keyspace Metrics:
Keyspace metrics track the health and size of your Redis database.
| Metric | Description | Significance |
|---|---|---|
| redis_db_avg_ttl_milliseconds | Avg TTL for keys with expiration | Zero/low shows poor TTL usage |
| redis_db_expires | Number of keys with expiration set | Indicates volatility of the dataset |
| redis_db_keys | Total keys in DB | Tracks growth and helps plan memory/sharding |
e) Eviction and Expiry Metrics:
Tracking key expiration and eviction helps manage memory and predict data loss scenarios.
| Metric | Description | Significance |
|---|---|---|
| redis_keys_evicted_total | Keys evicted due to memory pressure | Indicates critical memory constraints |
| redis_keys_expired_total | Keys expired via TTL | Ensures TTL policies are active and effective |
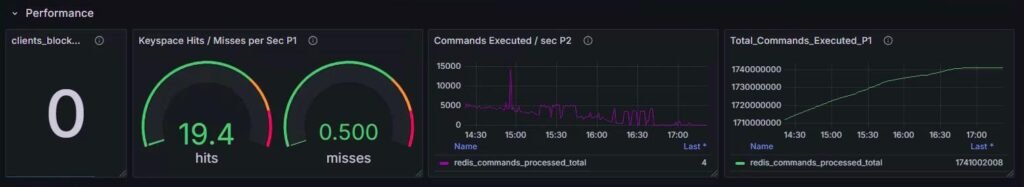
3. Performance:
a) Cache Hit/Miss Metrics
Hit/miss rates are key indicators of cache effectiveness.
| Metric | Description | Significance |
|---|---|---|
| redis_keyspace_hits_total | Successful key lookups | High values indicate effective caching |
| redis_keyspace_misses_total | Failed key lookups | May show bad cache strategies or cold starts |
b) Client Metrics:
Monitoring client activity is crucial to ensure Redis can handle the expected load without becoming overwhelmed.
| Metric | Description | Significance |
|---|---|---|
| redis_clients_blocked | Clients blocked on commands like BLPOP | Indicates delays due to blocking ops |
c) Command Metrics:
Command execution rates provide insight into Redis workload and efficiency.
| Metric | Description | Significance |
|---|---|---|
| redis_commands_per_second | Commands processed per second | Tracks Redis load and spikes in usage |
| redis_commands_processed_total | Total commands since start | Helps in long-term usage analysis |
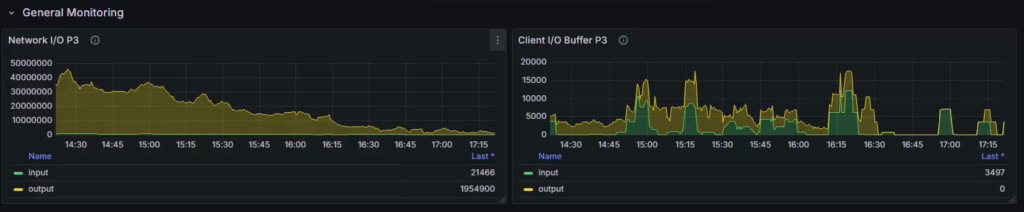
4. General Monitoring:
a) Network Traffic Metrics
Network throughput metrics help you size and tune Redis’s network footprint.
| Metric | Description | Significance |
|---|---|---|
| redis_net_input_bytes_total | Total incoming traffic | Helps spot ingestion spikes |
| redis_net_output_bytes_total | Total outgoing traffic | Useful for sizing Redis’s outbound load |
Overall Dashboard:
Benefits of Using Open Telemetry:
| Advantage | Description |
|---|---|
| No Redis Exporter Needed | Cleaner and simpler architecture |
| Native OTEL Integration | Reduced complexity and config overhead |
| Unified Pipeline | Handle metrics, logs, and traces in one flow |
| Lighter Setup | Fewer components to manage in containerized environments |
Conclusion
Using Open Telemetry’s Redis receiver, you can monitor Redis directly without needing an extra exporter. This approach is clean, efficient, and works well in containerized or microservices environments.
By tracking key metrics like memory usage, blocked clients, and command rate, you ensure Redis stays healthy, fast, and scalable.