What without Internet?

I had a dream a few days ago in which the existence of the internet was gone, When I woke up I thought about what would happen if there is no Internet for a day?
Sure, it would cause quite a bit of panic and uproar and it would be havoc for an organization to work without the internet, but if the internet resumed normally after 24 hours are over, things would return to normal pretty quickly.
Now, switch it off for a longer time, possibly a week or a month, that would have a more lasting impact, since, in that time, a significant number of people would find themselves unable to meet their obligations or do their business at all. This would be somewhat mitigated by the fact that the situation is a sort of a ‘natural disaster’, but still, those who really depend on the internet for their business would likely feel a lasting negative impact.
What if I say there are some organizations that work in a situation like there is no internet, yes it’s right due to some sort of security reasons they don’t prefer to use the public internet. Banks, space organizations, and many security agencies fall under this category.
Now, a question arises here how they manage to do regular updates and the installation of different packages in their different systems? The answer is quite simple: “the use of satellite server”.
Recently I got a task in relation to this context, in which:
1. A prerequisite here is that you don’t have internet connectivity in your system but one of the systems with which you can connect has internet connectivity.
2. Setup individual satellite server in your local network.
3. Install packages and regular updates.
To do so here I prefer to use the FTP satellite server
How to implement Ftp satellite server

Pre-requisites
An Ubuntu Server, and a non-root user with sudo privileges.
The system is configured with vsftpd
Suppose we are doing the installation of Jenkins
Make a directory pkg.jenkins.io in /var/www/html/
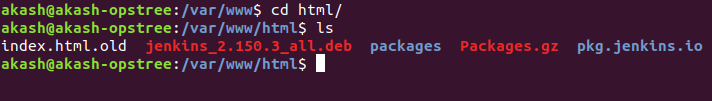
Contents of pkg.jenkins.io

Paste the host link of debian file in /etc/apt/source.list.d


Run the command sudo apt-get update

Now run the command for installation of the package

“ The internet made fame wack and anonymity cool ”
So, far from the above context, we have learned about setting up FTP for users with a local account. If you need to use an external authentication source, you might want to look into vsftpd’s support of virtual users. This offers a rich set of options through the use of PAM, the Pluggable Authentication Modules, and is a good choice if you manage users in another system such as LDAP or Kerberos.
I hope I explained everything clearly enough to understand. If you have some better way of implementing a satellite server please help me to improve this blog.
Thanks for reading my writing. I’d really appreciate any kind of feedback in the comments.
Cheers till next time!!!!