In modern distributed systems, observability is not a luxury—it’s a necessity. At the center of this landscape stands the Open Telemetry Collector, acting as the critical data pipeline responsible for receiving, processing, and exporting telemetry signals (traces, metrics, logs).
However, monitoring the monitor itself presents unique challenges. When your OpenTelemetry Collector becomes a bottleneck or fails silently, your entire observability stack suffers. This comprehensive guide will walk you through production-tested strategies for monitoring your OpenTelemetry Collector’s performance, ensuring your observability infrastructure remains robust and reliable.
Table of Contents
Why Monitor the Open Telemetry Collector
Without active monitoring, the Open Telemetry Collector can silently drop telemetry data, over-consume resources, or fail to export traces and metrics. Its failure undermines visibility into the system it’s meant to observe.
Monitoring ensures:
- Proactive issue detection (e.g., telemetry drops, high CPU usage)
- Resource usage awareness (CPU, memory, queue sizes)
- SLA enforcement and capacity planning
- Debugging efficiency across distributed systems
How to Enable Open Telemetry Collector Monitoring
Monitoring the Open Telemetry Collector involves enabling metrics scraping and exposing internal metrics through supported protocols.
a. Pull-Based Metrics Collection
In development or small-scale environments, the simplest approach is to scrape internal metrics using Prometheus.
Example Configuration:
receivers:
  prometheus:
    config:
      scrape_configs:
      - job_name: otel-collector
        scrape_interval: 10s
        static_configs:
          - targets: ['127.0.0.1:8888']

service:
  pipelines:
    metrics:
      receivers: [prometheus]
      exporters: []

  telemetry:
    metrics:
      level: detailed
      readers:
        - pull:
            exporter:
              prometheus:
                host: 127.0.0.1
                port: 8888
This configuration exposes internal collector metrics at http://localhost:8888/metrics.
b. Self-Monitoring Configuration
For production environments, it’s recommended to enable self-monitoring pipelines that scrape the collector’s internal state and forward it to external observability platforms.
Production-Grade Remote Export Example:
exporters:
  prometheusremotewrite:
    endpoint: ${PROMETHEUS_ENDPOINT}
    retry_on_failure:
      enabled: true

service:
  pipelines:
    metrics:
      receivers: [prometheus]
      exporters: [prometheusremotewrite]
Key Considerations:
- Use prometheusremotewrite for Prometheus-compatible backends (e.g., AWS Managed Prometheus, Grafana Cloud).
- Set level: detailed in telemetry settings to expose granular metrics.
- Secure endpoint access with authentication extensions such as sigv4auth, basicauth, or oauth2.

Key Metrics to Monitor
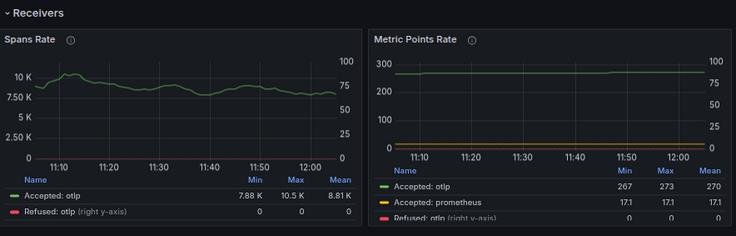
1. Receiver Metrics

| Metric | Purpose |
|---|---|
| otelcol_receiver_accepted_spans | Spans successfully received |
| otelcol_receiver_refused_spans | Spans rejected or dropped |
| otelcol_receiver_accepted_metric_points | Inbound metric volume |
| otelcol_receiver_accepted_log_records | Logs processed at receiver level |
2. Processor Metrics
| Metric | Purpose |
|---|---|
| otelcol_processor_dropped_spans | Indicates data loss during processing |
| otelcol_processor_batch_send_size | Reveals batch optimization efficiency |
| otelcol_processor_dropped_metric_points | Failed metric transformations |
3. Exporter Metrics
| Metric | Purpose |
|---|---|
| otelcol_exporter_sent_spans | Exported span count |
| otelcol_exporter_send_failed_requests | Failed export operations |
| otelcol_exporter_queue_size | Active items in queue |
| otelcol_exporter_queue_capacity | Max queue size before drops begin |
4. System Metrics
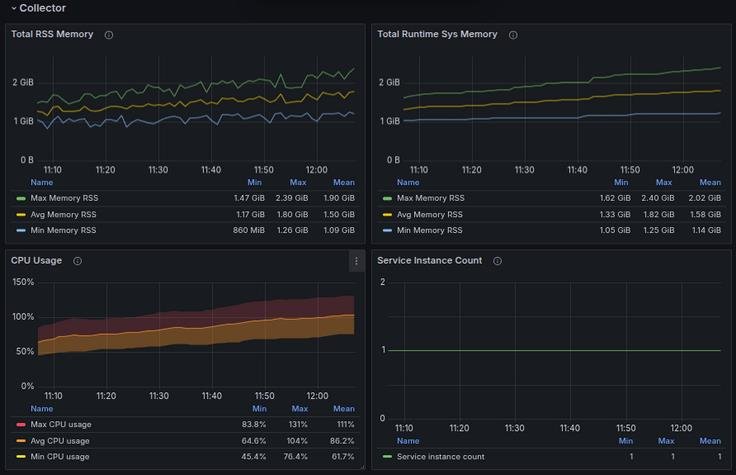
| Metric | Purpose |
|---|---|
| otelcol_process_cpu_seconds_total | Collector CPU usage |
| otelcol_process_resident_memory_bytes | Memory (RSS) footprint |
| otelcol_runtime_heap_alloc_bytes | Heap memory usage |
| otelcol_process_uptime_seconds | Instance uptime duration OpenTelemetry Dashboards |
OpenTelemetry Dashboards
Recommended Dashboard Layout in Grafana
| Section | Panels to Include |
|---|---|
| Receiver Stats | Accepted vs refused spans, metrics, logs |
| Processor Metrics | Dropped spans, batch sizes, processing latency |
| Exporter Stats | Export success/failure, queue utilization |
| System Health | CPU, memory, uptime, GC pauses |
| Signal Flow Visualization | Custom traces of processing paths or queue buildup |
Dashboard Best Practices:
-
- Use service.instance.id as a templating variable to track multiple collector instances.
- Visualize queue sizes and failure rates over time.
- Overlay export success/failure with backend service SLAs for correlation.
Alerting on Open Telemetry Collector
Proactive alerting is essential to ensure the collector operates within expected thresholds.
Sample Prometheus Alert Rules
groups:
- name: otel-collector-alerts
  rules:

- alert: DroppedSpansDetected
  expr: sum(rate(otelcol_processor_dropped_spans[5m])) > 0
  for: 2m
  labels:
    severity: critical
  annotations:
    summary: Spans dropped in OpenTelemetry Collector
    description: Spans are being dropped by processor. Check throughput and configuration.

- alert: ExporterFailures
  expr: sum(rate(otelcol_exporter_send_failed_requests[5m])) > 0
  for: 5m
  labels:
    severity: high
  annotations:
    summary: Exporter failures detected
    description: Exporter failed to send telemetry data. Investigate backend availability.

- alert: HighQueueUsage
  expr: max(otelcol_exporter_queue_size / otelcol_exporter_queue_capacity) > 0.85
  for: 5m
  labels:
    severity: warning
  annotations:
    summary: Exporter queue nearing full capacity
    description: Collector queue size is nearing maximum. Risk of data drop

- alert: MemoryLeakSuspected
  expr: avg_over_time(otelcol_process_resident_memory_bytes[10m]) > 1.5e+09
  for: 10m
  labels:
    severity: warning
  annotations:
    summary: High sustained memory usage
    description: Memory usage is elevated. Review batch sizes and signal load

- alert: CPUThresholdExceeded
  expr: rate(otelcol_process_cpu_seconds_total[1m]) * 100 > 90
  for: 2m
  labels:
    severity: warning
  annotations:
    summary: High CPU usage detected
    description: Collector CPU utilization exceeds safe limits. Evaluate load balancing strategy.
Best Practices
- Label and Template Your Collector Instances: Use unique labels like instance, environment, and region.
- Scrape Every 10s in Production: Ensures high-resolution visibility without overwhelming Prometheus.
- Instrument Signal Flow with Custom Tags: Helps trace specific services through collector pipelines.
- Tune Processor and Exporter Queues: Adjust queue capacity based on throughput and downstream latency.
- Use Canary Collectors: Deploy test instances to validate new configurations or upgrades.
Conclusion
The Open Telemetry Collector is foundational to any observability infrastructure. Yet, it must not be treated as a black box. Proactively monitoring its health, performance, and reliability is mission-critical.
By following the practices outlined in this guide—enabling detailed metrics collection, building dashboards, and defining actionable alerts—you can confidently operate and scale the Open Telemetry Collector in production environments.
A well-monitored collector leads to a well-observed system.