Why Alarms Matter in Cloud Infrastructure
Proactive monitoring for reliable cloud systems
The Critical Role of Monitoring
In any modern cloud-based architecture, monitoring and alerting play a critical role in maintaining reliability, performance, and security.
Beyond Just Logs
It’s not enough to just have logs-you need a way to act on those logs when something goes wrong. That’s where CloudWatch alarms come.
The Cost of Being Reactive
Imagine a situation where your application starts throwing 5xx errors, and you don’t know until a customer reports it. By the time you act, you’ve already lost trust.
Alarms prevent this reactive chaos by enabling proactive monitoring—you get notified the moment an issue surfaces, allowing you to respond before users even notice.
The Risks of Operating Without Alarms
!
Missed Error Spikes
You might miss spikes in 4xx/5xx errors that indicate growing problems.
⌛
Reactive Mode
You’re always proactive instead of reactive.
👁️
Lack of Visibility
Your team lacks visibility into critical system behavior.
🔍
Diagnosis Challenges
Diagnosing issues becomes more difficult without early signals.
The CloudWatch Alarm Solution
Due to all the reasons above, that’s why I decided to implement AWS CloudWatch Alarms using Metric Filters—a cost-effective, powerful way to monitor logs and trigger alerts based on specific patterns.
Why Choose Amazon CloudWatch
We Choose Amazon CloudWatch Because:
- It offers native support for metric filtering and alarms.
- It’s scalable and works well with EC2 instances, ECS, EKS, Lambda, etc.
- It’s cost-effective for log-based monitoring.
Instead of pushing logs to third-party tools, we kept everything inside AWS for tighter security and easier maintenance.
How to Implement CloudWatch Alarms
Follow these steps to set up comprehensive monitoring with CloudWatch:
1
Install the CloudWatch Agent (For EC2 Logs)
🔗 Official AWS Setup Guide
💡 Pro Tip: Create a custom config file to push only needed logs to reduce noise and cost.
2
️Create an IAM Role for CloudWatch Agent
logs:CreateLogGroup
logs:CreateLogStream
logs:PutLogEvents
cloudwatch:PutMetricData
Attach this role to your EC2 instance running the CloudWatch Agent.
3
Create Metric Filters for Your Log Group
Go to:
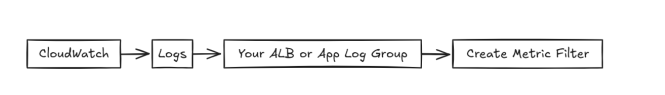
Example patterns for common error monitoring:
4xx Errors
[…statusCode=%4[0-9]{2}%…]
5xx Errors
[…statusCode=%5[0-9]{2}%…]
For Each Filter:
- Click Test Pattern
- Create Metric → Give Namespace (Example: Custom/ALB/ErrorMetrics)
- Metric Value: Set as 1
4
Setup SNS (Simple Notification Service) for Alerts
SNS = Your Notification Pipeline
If you don’t have an SNS Topic:
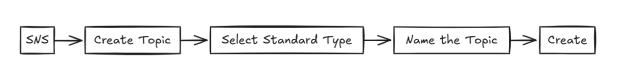
To add email recipients:
- Open the SNS Topic
- Create Subscription → Protocol: Email → Enter Email IDs → Create
- Team members will get a confirmation email (They must click confirm!)
In your Alarm setup, select this SNS topic under Notification section.
5
Create CloudWatch Alarms on These Metrics
Once your Metric Filters are in place and actively generating metrics, it’s time to put CloudWatch Alarms into action. This is where the magic happens—turning raw log patterns into real-time alerts.
Example Alarm Scenarios:
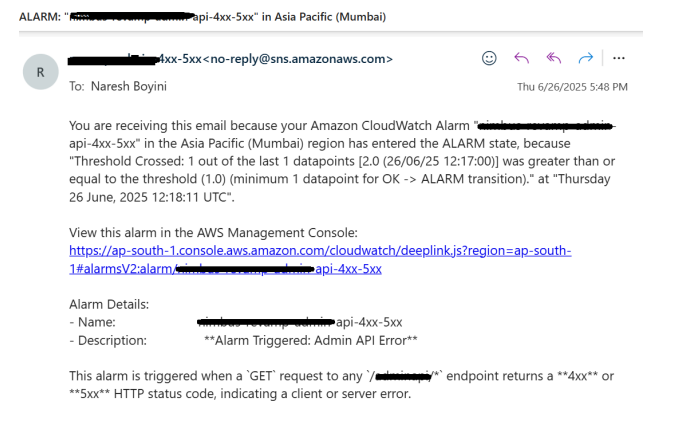
If 5xx errors > 5 within 5 minutes → Trigger an Alert
If 4xx errors > 10 within 10 minutes → Trigger an Alert
If Large payloads (>100KB) exceed 50 events in 1 hour → Trigger an Alert
Detailed Steps to Create CloudWatch Alarms
1
Go to AWS Console → CloudWatch → Alarms → Create Alarm
2
Click Select metric → Choose “Log Metrics”
3
Browse and select your custom metric (created earlier using Metric Filters)
Then click Select Metric
Under Conditions:
- Choose the threshold type (Static/Anomaly detection)
- Set threshold value (example: Greater than 5 errors)
- Choose datapoint evaluation (e.g., 1 out of 1 datapoint breaching threshold)
Under Actions:
- Select an existing SNS topic or create a new one
- Add a name and description for identification (e.g., ALB-5XX-Error-Alarm)
- Click Create Alarm
💡
Bonus Tip
For production workloads, set lower thresholds and tighter evaluation periods for critical errors (like 5xx). Once the alarm triggers, it will automatically publish a notification to the configured SNS topic, sending alerts to your team instantly! ✅
The Payoff
✅
Faster Issue Detection
Identify problems immediately when they occur, not when users report them.
✅
Proactive Responses
Fix issues before customers notice or complain about them.
✅
Improved Uptime
Maintain higher system availability with quicker incident response.
✅
AWS Native Solution
Everything stays securely within your AWS ecosystem.
Final Thoughts
If you’re not using CloudWatch alarms yet…
you’re basically driving without a dashboard. 😅
It’s simple, cost-effective, and your future self (and your customers) will thank you.
Related
