
Table of Contents
- A Practical PoC to Validate Error & Slow Query Log Reliability
- Objective
- Architecture Overview
- Phase 1 – Infrastructure Setup
- Phase 2 – Preparing the Database for Testing
- Phase 3 – Initiating Log Export Configuration Change
- Phase 4 – Real-Time Stress Testing During Modification
- Phase 5 – Final Results & Validation
- Phase 6 – Evidence (Screenshots & Snippets)
- Key Findings
- Business Impact
- Recommendations
- Estimated Time Allocation (ETA)
- Cleanup
A Practical PoC to Validate Error & Slow Query Log Reliability
Operational visibility is the backbone of stable, predictable infrastructure. For teams relying on Error Logs and Slow Query Logs for troubleshooting, monitoring, and compliance, losing log access even for a few minutes can cause blind spots during critical events.
As part of my DevOps journey, I was tasked with validating a real-world operational concern:
Do Aurora MySQL Error and Slow Query logs remain accessible and updated in real time during log configuration changes?
This blog covers the end-to-end PoC, the test conditions, observations, validations, and the final verdict.
The goal was simple:
Ensure zero impact to logging visibility even when Aurora is modifying its internal log export configuration.
Objective
The PoC verifies:
- Error logs remain readable during log export changes
- Slow query logs continue updating during modification
- Applications can continue fetching logs without interruption
- No downtime or performance degradation occurs
This test simulates a common maintenance scenario for SRE/DevOps teams that adjust log settings for performance or compliance.
Architecture Overview
The PoC uses a minimal setup replicating a production-like environment:
| Component | Role |
|---|---|
| Aurora MySQL Cluster | Database with modifiable log exports |
| EC2 Test Machine | Executes SQL queries and generates log events |
| AWS Console | Used for modifying log settings and verifying logs |
| MySQL Client | Generates slow queries, errors, and normal writes |
Test Flow
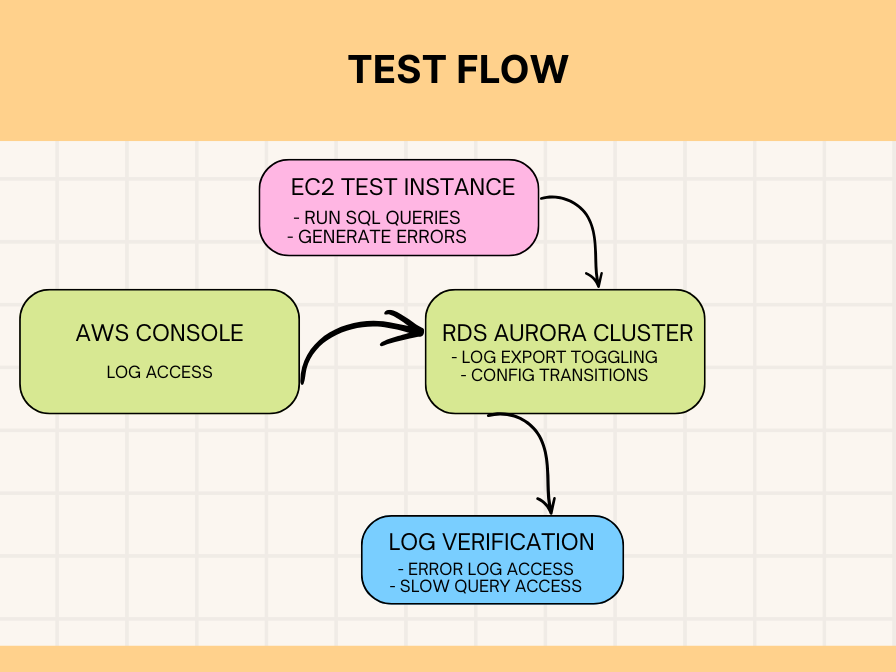
This setup ensures we can test log availability while Aurora is actively applying configuration changes, the most sensitive moment for log continuity.
Phase 1 – Infrastructure Setup
Step 1.1 – Spin Up Aurora MySQL Cluster
Using the RDS console:
- Engine: Amazon Aurora MySQL
- Template: Dev/Test
- Cluster Identifier:
testing-aurora-cluster - Log Exports (initial):
- Audit
- Error
- General
- Slow query
This ensures a baseline where all logs are initially active.
Step 1.2 – Launch EC2 Test Instance
A simple Ubuntu server (t3.micro) is enough.
Install MySQL client:
sudo apt update
sudo apt install mysql-client -y
This EC2 box will be used to simulate workload and generate controlled logs.
Phase 2 – Preparing the Database for Testing
Connect from EC2:
mysql -h testing-aurora-cluster-instance-1.xxxxx.us-west-2.rds.amazonaws.com -u admin -p
Create test schema, table, and a stored procedure:
CREATE DATABASE IF NOT EXISTS log_test;
USE log_test;

CREATE TABLE test_table (
    id INT AUTO_INCREMENT PRIMARY KEY,
    data VARCHAR(255),
    created_at TIMESTAMP DEFAULT CURRENT_TIMESTAMP
);

INSERT INTO test_table (data)
VALUES ('test_data_1'), ('test_data_2'), ('test_data_3');

DELIMITER $$

CREATE PROCEDURE GenerateTestQueries()
BEGIN
    DECLARE i INT DEFAULT 0;

    WHILE i < 10 DO
        INSERT INTO test_table (data)
        VALUES (CONCAT('loop_data_', i));

        SET i = i + 1;
    END WHILE;
END$$

DELIMITER ;
This ensures plenty of activity for both error and slow query logs.
Phase 3 – Initiating Log Export Configuration Change
This is the heart of the PoC.
Step 3.1 – Confirm Initial State
Both the cluster and instance show:
- Status: Available
- Log Exports: 4 logs enabled
Step 3.2 – Modify Log Configuration
From the RDS console → Modify cluster:
- Disable Audit log
- Disable General log
- Keep Error log
- Keep Slow Query log
Apply immediately to test real-time behavior.
Step 3.3 – Watch Status Transition
Expected instance status:
Configuring log exports
This is where the PoC becomes meaningful – Aurora is internally adjusting log pipelines.
Phase 4 – Real-Time Stress Testing During Modification
With the instance in “Configuring log exports“, we immediately generate workload.
Slow Query Generators:
With the instance in “Configuring log exports“, we immediately generate workload.
Slow Query Generators:
SELECT SLEEP(2);
SELECT SLEEP(3);
SELECT BENCHMARK(1000000, MD5('test'));
Error Generators:
SELECT * FROM non_existent_table;
INSERT INTO non_existent_table VALUES (1);
Normal Writes & Heavy Query:
CALL GenerateTestQueries();

INSERT INTO test_table (data) VALUES ('modifying_state_test');

SELECT t1.*, (SELECT COUNT(*) FROM test_table t2) AS total_count
FROM test_table t1
WHERE t1.data LIKE '%test%';
This guarantees enough fresh activity to validate real-time log updates.
Phase 4.1 – Log Access During Modification
Without waiting, we go to:
RDS Console → Database → Logs & Events
What we tested:
| Action | Error Log | Slow Query Log |
|---|---|---|
| View log | ✔ | ✔ |
| Download log | ✔ | ✔ |
| Watch real-time updates | ✔ | ✔ |
| Confirm new entries appear | ✔ | ✔ |
Both logs remained fully functional even during active configuration changes.
Phase 5 – Final Results & Validation
5.1 – Log Availability Matrix
| Log Type | Accessible During Change? | New Entries Visible? | Behavior |
|---|---|---|---|
| Error Log | ✔ Yes | ✔ Immediate | Stable |
| Slow Query Log | ✔ Yes | ✔ Within seconds | Reliable |
| Audit Log | Disabled | N/A | N/A |
| General Log | Disabled | N/A | N/A |
5.2 – Observations
- Cluster availability: 100%
- No connection drops from EC2
- No query failures
- Configuration change time: ~3–5 minutes
- Log latency: negligible
This strongly suggests Aurora maintains independent internal pipelines for Error & Slow Query logs, unaffected by export toggles.
Phase 6 – Evidence (Screenshots & Snippets)
Sample Error Log During Modification
2025-11-05T10:08:06.105852Z 22 [Note] 'wait_timeout' exceeded
2025-11-05T10:12:55.134589Z 69 [Note] Failed query: table doesn't exist
-- Continuous entries observed during "Configuring log exports" --
Slow Query Log Captured:
SELECT SLEEP(2)SELECT SLEEP(3)BENCHMARK()heavy queries- Complex COUNT() subquery
All persisted exactly as expected.
Key Findings
SUCCESS: Logs remain fully available
Error & Slow Query logs were continuously readable and consistently updated.
ZERO impact on application clients
Connections, performance, and log retrieval remained unaffected.
SAFE to modify logs during maintenance
This PoC confirms that log configuration changes carry minimal to zero risk for monitoring stacks.
Business Impact
For monitoring, SRE and DevOps teams:
- No loss of visibility
- No alerting gaps
- No impact on troubleshooting
- No impact on audit/compliance pipelines
- Safe to adjust logs during production maintenance windows
This increases confidence in Aurora’s operational stability.
Recommendations
- Modify logs during maintenance windows (best practice, but not mandatory)
- Keep Error & Slow Query logs always enabled for critical systems
- Notify application teams before changes (for awareness)
- Periodically test log pipelines in non-prod
- Use this PoC pattern for validating future operational behaviors
Estimated Time Allocation (ETA)
| Phase | Duration |
|---|---|
| Infra Setup | 20–30 min |
| DB Preparation | 10–15 min |
| Log Modification | 5–10 min |
| Real-Time Testing | 5–10 min |
| Validation & Documentation | 10–15 min |
| Total | ~60–80 minutes |
Cleanup
To avoid unnecessary AWS charges:
RDS → Databases → Select Cluster → Delete
→ Skip final snapshot
More Resources
- Windows Exporter Setup for Monitoring MSSQL on Windows Server
- How OpsZilla Achieved Zero-Downtime MySQL Migration with Scalable Data Engineering Practices