MySQL Monitoring

In recent time, I invested a good amount of time in learning and working on monitoring esp. Database Monitoring. So I found this medium the best way to share my journey, findings and obviously spectacular dashboards.

This blog will help you understand why we need MySQL monitoring and how we can do it.

Let’s start with the need to implement MySQL monitoring. There are multiple areas which we can monitor, here I am enlightening some important ones.

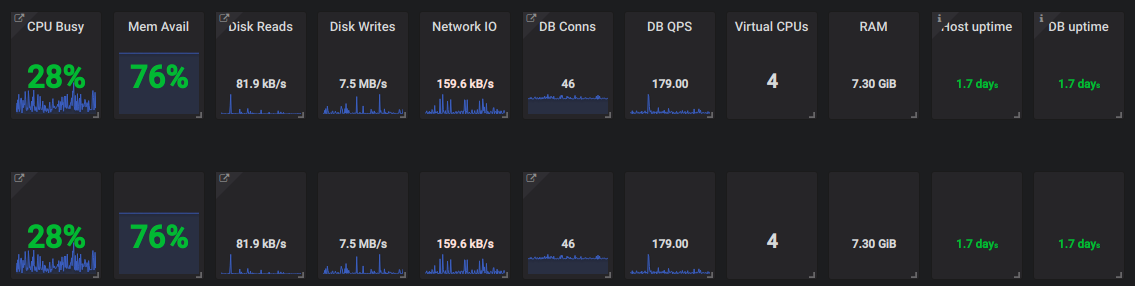
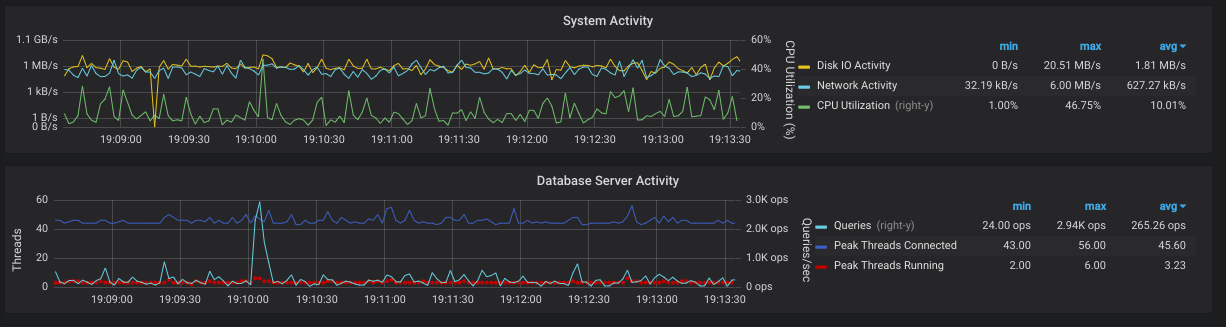
1. Resource Utilization
First of all, you have no idea what’s going on with MySQL, you can not know if it’s in a haywire state if there is no monitoring.
    An ample number of queries run through it. Some of them are lightweight and some of them are very heavy which makes CPU over-utilized or overload. In that case, if we talk about production, a number of requests can be flushed out making it a business loss.

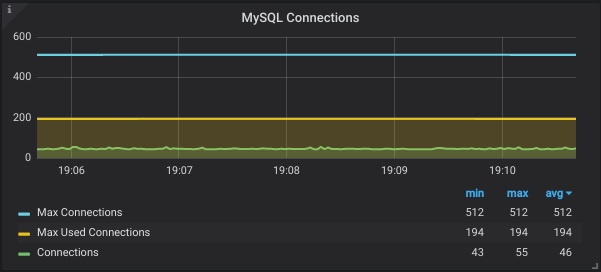
2. Database Connections
Sometimes the number of connections run out and no further connections are left for application to communicate with DB. In the absence of monitoring, it’s really hard to figure out the root cause.
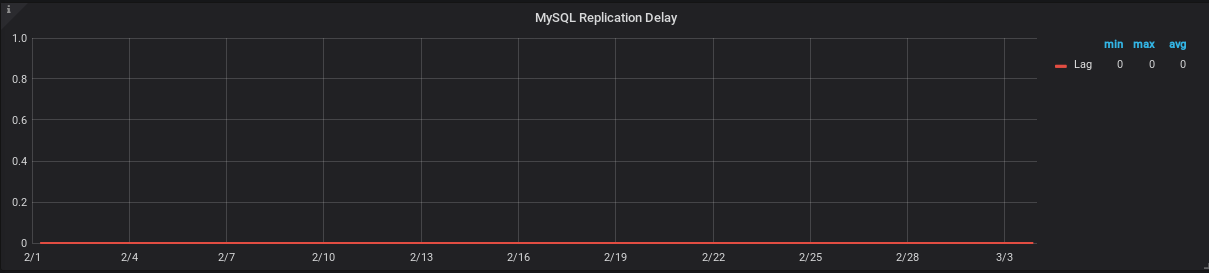
3. Replication Lag
When we use MySQL as a master-slave cluster, real-time replication of data from the master to slave is a key factor to monitor. The lag between master and slave should be zero.

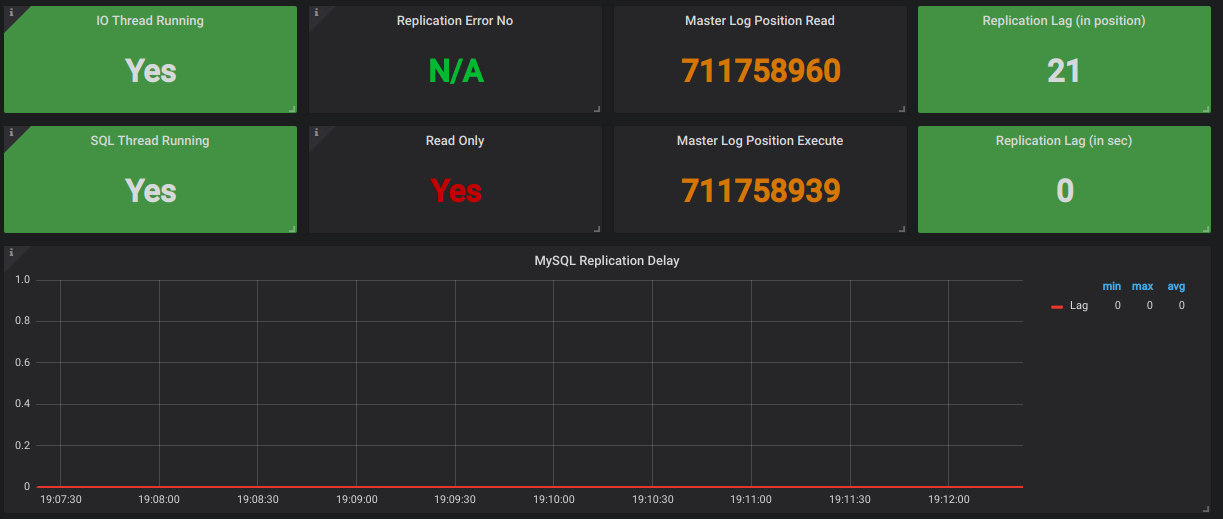
In my scenario, the slave is being used for DB replication from the master and also serving read queries to avoid overburden on the master. Now if replication lag is high and at the same time if any read query is triggered for the slave, what will happen? The same data which is on the master will not get replicated on the slave because of replication lag!
That read query will show an unexpected or erroneous result.
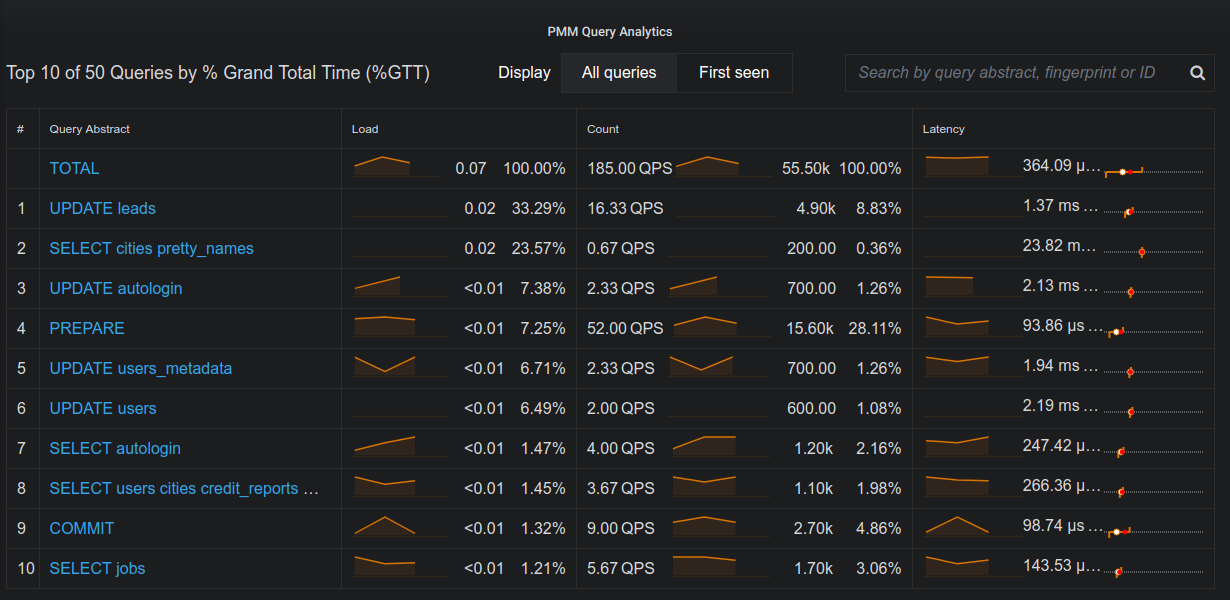
4. Query Analytics
Monitoring DB also helps in identify what queries are taking a long time. It helps in identify and optimize slow queries. At the end its all about being fast.

Ok, so how to monitor MySQL. There are multiple enterprise solutions available to monitor Database with a single click solution, but I didn’t have the luck to go for paid solutions. So, I have started exploring open source solutions which will cover all my requirements. Finally, I got one.

Its Percona Monitoring And management (PMM)Tool

PMM is an open-source platform to monitor and manage MySQL Database, that we can run in own environment. It provides a time-series database which ensures reliable and real-time data.

Installing PMM Server

curl -fsSL https://raw.githubusercontent.com/percona/pmm/master/get-pmm.sh  -o get-pmm.sh

Change permission to make it executable

chmod +x get-pmm.sh

Now run pmm script to install it.

./ get-pmm.sh

This will run a docker container. Once docker container is up and running we will install PMM client and will bind the port

Installing PMM Client

Add the below repo

wget https://repo.percona.com/apt/percona-release_0.1-6.$(lsb_release -sc)_all.deb

Install the package from added repository

dpkg -i percona-release_0.1-6.$(lsb_release -sc)_all.deb

Update your ubuntu follow below steps:

apt-get update 
pmm-admin config --server <server_ip>:<port>-get update 
pmm-admin add mysql

It’s not only MySQL you can monitor, in fact, but pmm also allows to integrate it with other databases as well like Amazon RDS, Postgres, and MongoDB.

There are many alternatives for MySQL monitoring in the market like Nagios, VividCortex Analyser, SolarWinds server and application monitor, LogicMonitor and Management tool, MySQL OpsPack etc. But exploring open-source tools has its pros and cons but the level of learning you get from it, that makes it worth using. So anyone out there reading this blog I would suggest to give it a try.

Happy monitoring!!

Image Source: https://www.kisspng.com/png-clip-art-brand-line-technology-text-messaging-6462820/preview.html

Stay Away Replication Lag !

Recently, I got a requirement to facilitate backup for the data and a way to analyze it without using the main database. MySQL replication is a process that allows you to easily maintain multiple copies of MySQL data by having them copied automatically from a master to a slave database. 

Panic Starts

Everything was running smoothly in the night I configured it. But the joy didn’t last for long as the traffic hits in the morning, slave starts getting behind the master with few seconds which increases with the activity on the application. At the peak time, it was playing in thousands of second.

 What now, I had to dig deep into MySQL Replication

  • How it works 
  • What can probably cause the lag
  • An approach that minimizes or eliminates it

How MySQL Replication Works

On the master

First of all, master writes replication events to a special log called binary log. This is usually a very lightweight activity because writes are buffered and they are sequential. The binary log file stores data that replication slave will be reading later.

On the replica

When you start replication, two threads are started on the slave:
1. IO thread
This process connects to a master, reads binary log events from the master as they come in and just copies them over to a local log file called relay log.
Even though there’s only one thread reading the binary log from the master and one writing relay log on the slave, very rarely copying of replication events is a slower element of the replication. There could be a network delay, causing a steady delay of a few hundred milliseconds.
If you want to see where IO thread currently is, check the following in “show slave status \G”
Master_Log_File – last file copied from the master (most of the time it would be the same as last binary log written by a master)
Read_Master_Log_Pos – binary log from the master is copied over to the relay log on the slave up until this position.
And then you can compare it to the output of “show master status/G” from the master.

mysql> show master status\G;
*************************** 1. row ***************************
             File: db01-binary-log.000032
         Position: 1008761891
     Binlog_Do_DB: 
 Binlog_Ignore_DB: 
Executed_Gtid_Set: 
1 row in set (0.00 sec)

2. SQL thread
The second process – SQL thread – reads events from a relay log stored locally on the replication slave (the file that was written by IO thread) and then applies them as fast as possible.
Going back to “show slave status /G”, you can get the current status of SQL thread from the following variables:
Relay_Master_Log_File – binary log from the master, that SQL thread is “working on” (in reality it is working on relay log, so it’s just a convenient way to display information)
Exec_Master_Log_Pos – which position from the master binary log is being executed by SQL thread.

mysql> show slave status\G;
*************************** 1. row ***************************
               Slave_IO_State: Waiting for master to send event
                  Master_Host: <master_ip>
                  Master_User: <replication_user>
                  Master_Port: 3306
                Connect_Retry: 60
              Master_Log_File: db01-binary-log.000032
          Read_Master_Log_Pos: 1008768810
               Relay_Log_File: relay-bin.000093
                Relay_Log_Pos: 1008769035
        Relay_Master_Log_File: db01-binary-log.000032
             Slave_IO_Running: Yes
            Slave_SQL_Running: Yes
.
.
          Exec_Master_Log_Pos: 1008768810
              Relay_Log_Space: 1008769305
.
.
        Seconds_Behind_Master: 0
.
.
      Slave_SQL_Running_State: Slave has read all relay log; waiting for more updates
.
.
1 row in set (0.00 sec)

Why Replication Lag Occurred

Replication lag occurs when the slaves cannot keep up with the updates occurring on the master. Unapplied changes accumulate in the slave’s relay logs and the version of the database on the slaves becomes increasingly different from that of the master.

Caught The Culprit

Let me take you through my journey how I crossed the river. 
First, I took the reference to multiple blogs and started gobbling my mind with possible reasons suggesting 

  • Hardware Faults (getting RAID in degraded mode)
  • MySQL Config Updates 
    • setting sync_binlog=1
    • enabling log_slave_updates
    • setting innodb_flush_log_at_trx_commit=1
    • updating slave_parallel_workers to a higher value
    • changing slave_parallel_type to support more parallel workers
  • Restarting Replication 

But unfortunately, or say, it was my benightedness towards Database Administration that I was still searching for that twig which can help me from drowning.
And finally, I found one, my DBA friend who suggested me to look for the Binary Log Format that I am using. Let’s see what it is

Binary Logging Formats

The server uses several logging formats to record information in the binary log. The exact format employed depends on the version of MySQL being used. There are three logging formats:
STATEMENT: With statement-based replication, every SQL statement that could modify data is logged on the master. Then those SQL statements are replayed on the slaves against the same dataset and in the same context. There is always less data that is to be transferred between the master and the slave. But, the data inconsistency issue between the master and the slave that creeps up due to the way this kind of replication works.
ROW: With row-based replication, every “row modification” is logged on the master and is then applied to the slave. With row-based replication, each and every change can be replicated and hence this is the safest form of replication. On a system that frequently UPDATE a large number of rows, it produces very large update logs and generates a lot of network traffic between the master and the slave.
MIXED: A third option is also available: mixed logging. With mixed logging, statement-based logging is used by default, but the logging mode switches automatically to row-based in certain cases.

Changing Binary Log Format

The Binary Log Format is updated on Master MySQL server and requires MySQL service restart to reflect. It can be done for Global, Runtime or Session.

  • set at runtime with –binlog-format=format
  • setting the global (with the SUPER privilege)
  • session value of the binlog_format server variable
mysql> SET GLOBAL binlog_format=MIXED;

mysql> SET SESSION binlog_format=ROW;

mysql> SET binlog_format=STATEMENT; 

So, earlier I was using STATEMENT BinLog Format, which is default one. Since I switched to MIXED BinLog Format, I am very delighted to share the below stats.
Current status of  Master Read and Slave Execute position difference and Slave Lag (in sec), both are ZERO.

Replication Lag (in Seconds) graph for a month, powered by Prometheus-Grafana.

Now, What’s next ??