Gitlab-CI with Nexus

Recently I was asked to set up a CI- Pipeline for a Spring based application.
I said “piece of cake”, as I have already worked on jenkins pipeline, and knew about maven so that won’t be a problem. But there was a hitch, “pipeline of Gitlab CI“. I said “no problem, I’ll learn about it” with a Ninja Spirit.
So for starters what is gitlab-ci pipeline. For those who have already work on Jenkins and maven, they know about the CI workflow of  Building a code , testing the code, packaging, and deploy it using maven. You can add other goals too, depending upon the requirement.
The CI process in GitLab CI is defined within a file in the code repository itself using a YAML configuration syntax.
The work is then dispatched to machines called runners, which are easy to set up and can be provisioned on many different operating systems. When configuring runners, you can choose between different executors like Docker, shell, VirtualBox, or Kubernetes to determine how the tasks are carried out.

What we are going to do?
We will be establishing a CI/CD pipeline using gitlab-ci and deploying artifacts to NEXUS Repository.

Resources Used:

  1. Gitlab server, I’m using gitlab to host my code.   
  2. Runner server, It could be vagrant or an ec2 instance. 
  3. Nexus Server, It could be vagrant or an ec2 instance.

     Before going further, let’s get aware of few terminologies. 

  • Artifacts: Objects created by a build process, Usually project jars, library jar. These can include use cases, class diagrams, requirements, and design documents.
  • Maven Repository(NEXUS): A repository is a directory where all the project jars, library jar, plugins or any other project specific artifacts are stored and can be used by Maven easily, here we are going to use NEXUS as a central Repository.
  • CI: A software development practice in which you build and test software every time a developer pushes code to the application, and it happens several times a day.
  • Gitlab-runner: GitLab Runner is the open source project that is used to run your jobs and send the results back to GitLab. It is used in conjunction with GitLab CI, the open-source continuous integration service included with GitLab that coordinates the jobs.
  • .gitlab-ci.yml: The YAML file defines a set of jobs with constraints stating when they should be run. You can specify an unlimited number of jobs which are defined as top-level elements with an arbitrary name and always have to contain at least the script clause. Whenever you push a commit, a pipeline will be triggered with respect to that commit.

Strategy to Setup Pipeline

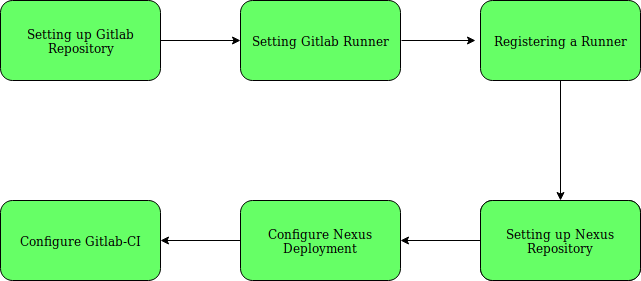
Step-1:  Setting up GitLab Repository. 

I’m using a Spring based code Spring3Hibernate, with a directory structure like below.
$    cd spring3hibernateapp
$    ls
     pom.xml pom.xml~ src

# Now lets start pushing this code to gitlab

$    git remote -v
     origin git@gitlab.com:/spring3hibernateapp.git (fetch)
     origin git@gitlab.com:/spring3hibernateapp.git (push)
# Adding the code to the working directory

$    git add -A
# Committing the code

$    git commit -m "[Master][Add] Adding the code "
# Pushing it to gitlab

$    git push origin master

Step-2:  Install GitLab Runner manually on GNU/Linux

# Simply download one of the binaries for your system:

$    sudo wget -O /usr/local/bin/gitlab-runner https://gitlab-runner-downloads.s3.amazonaws.com/latest/binaries/gitlab-runner-linux-386

# Give it permissions to execute:

$    sudo chmod +x /usr/local/bin/gitlab-runner 

# Optionally, if you want to use Docker, install Docker with:

$    curl -sSL https://get.docker.com/ | sh 

# Create a GitLab CI user:

$    sudo useradd --comment 'GitLab Runner' --create-home gitlab-runner --shell /bin/bash 

# Install and run as service:

$    sudo gitlab-runner install --user=gitlab-runner --working-directory=/home/gitlab-runner
$    sudo gitlab-runner start

Step-3: Registering a Runner

To get the runner configuration you need to move to gitlab > spring3hibernateapp > CI/CD setting > Runners
And get the registration token for runners.

# Run the following command:

$     sudo gitlab-runner register
       Runtime platform                                    arch=amd64 os=linux pid=1742 revision=3afdaba6 version=11.5.0
       Running in system-mode.                             

# Please enter the gitlab-ci coordinator URL (e.g. https://gitlab.com/):

https://gitlab.com/

# Please enter the gitlab-ci token for this runner:

****8kmMfx_RMr****

# Please enter the gitlab-ci description for this runner:

[gitlab-runner]: spring3hibernate

# Please enter the gitlab-ci tags for this runner (comma separated):

build
       Registering runner... succeeded                     runner=ZP3TrPCd

# Please enter the executor: docker, docker-ssh, shell, ssh, virtualbox, docker+machine, parallels, docker-ssh+machine, kubernetes:

docker

# Please enter the default Docker image (e.g. ruby:2.1):

maven       
       Runner registered successfully. Feel free to start it, but if it's running already the config should be automatically reloaded!

# You can also create systemd service in /etc/systemd/system/gitlab-runner.service.

[Unit]
Description=GitLab Runner
After=syslog.target network.target
ConditionFileIsExecutable=/usr/local/bin/gitlab-runner

[Service]
StartLimitInterval=5
StartLimitBurst=10
ExecStart=/usr/local/bin/gitlab-runner "run" "--working-directory" "/home/gitlab-runner" "--config" "/etc/gitlab-runner/config.toml" "--service" "gitlab-runner" "--syslog" "--user" "gitlab-runner"
Restart=always
RestartSec=120

[Install]
WantedBy=multi-user.target

Step-4: Setting up Nexus Repository
You can setup a repository installing the open source version of Nexus you need to visit Nexus OSS and download the TGZ version or the ZIP version.
But to keep it simple, I used docker container for that.
# Install docker

$    curl -sSL https://get.docker.com/ | sh

# Launch a NEXUS container and bind the port

$    docker run -d -p 8081:8081 --name nexus sonatype/nexus:oss

You can access your nexus now on http://:8081/nexus.
And login as admin with password admin123.

Step-5: Configure the NEXUS deployment

Clone your code and enter the repository

$    cd spring3hibernateapp/

# Create a folder called .m2 in the root of your repository

$    mkdir .m2

# Create a file called settings.xml in the .m2 folder

$    touch .m2/settings.xml

# Copy the following content in settings.xml

<settings xsi:schemaLocation="http://maven.apache.org/SETTINGS/1.1.0 http://maven.apache.org/xsd/settings-1.1.0.xsd"
    xmlns="http://maven.apache.org/SETTINGS/1.1.0" xmlns:xsi="http://www.w3.org/2001/XMLSchema-instance">
  
    
      central
      ${env.NEXUS_REPO_USER}
      ${env.NEXUS_REPO_PASS}
    
    
      snapshots
      ${env.NEXUS_REPO_USER}
      ${env.NEXUS_REPO_PASS}


 Username and password will be replaced by the correct values using variables.
# Updating Repository path in pom.xml


     central
     Central
     ${env.NEXUS_REPO_URL}central/
   
 
          snapshots
          Snapshots
          ${env.NEXUS_REPO_URL}snapshots/
        

Step-6: Configure GitLab CI/CD for simple maven deployment.

GitLab CI/CD uses a file in the root of the repo, named, .gitlab-ci.yml, to read the definitions for jobs that will be executed by the configured GitLab Runners.
First of all, remember to set up variables for your deployment. Navigate to your project’s Settings > CI/CD > Variables page and add the following ones (replace them with your current values, of course):
  • NEXUS_REPO_URL: http://:8081/nexus/content/repositories/ 
  • NEXUS_REPO_USER: admin
  • NEXUS_REPO_PASS: admin123

Now it’s time to define jobs in .gitlab-ci.yml and push it to the repo:

image: maven

variables:
  MAVEN_CLI_OPTS: "-s .m2/settings.xml --batch-mode"
  MAVEN_OPTS: "-Dmaven.repo.local=.m2/repository"

cache:
  paths:
    - .m2/repository/
    - target/

stages:
  - build
  - test
  - package 
  - deploy

codebuild:
  tags:
    - build      
  stage: build
  script: 
    - mvn compile

codetest:
  tags:
    - build
  stage: test
  script:
    - mvn $MAVEN_CLI_OPTS test
    - echo "The code has been tested"

Codepackage:
  tags:
    - build
  stage: package
  script:
    - mvn $MAVEN_CLI_OPTS package -Dmaven.test.skip=true
    - echo "Packaging the code"
  artifacts:
    paths:
      - target/*.war
  only:
    - master  

Codedeploy:
  tags:
    - build
  stage: deploy
  script:
    - mvn $MAVEN_CLI_OPTS deploy -Dmaven.test.skip=true
    - echo "installing the package in local repository"
  only:
    - master

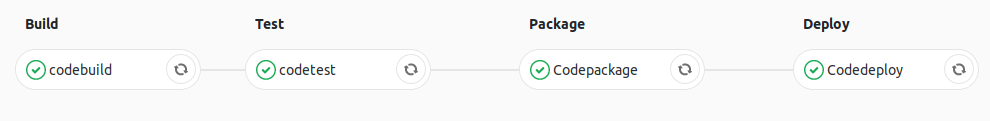
Now add the changes, commit them and push them to the remote repository on gitlab. A pipeline will be triggered with respect to your commit. And if everything goes well our mission will be accomplished.
Note: You might get some issues with maven plugins, which will need to managed in pom.xml, depending upon the environment.
In this blog, we covered the basic steps to use a Nexus Maven repository to automatically publish and consume artifacts.

Linux Namespaces – Part 1

Overview

First of all I would like to give credit to Docker which motivated me to write this blog, I’ve been using docker for more then 6 months but I always wondered how things are happening behind the scene. So I started in depth learning of Docker and here I am talking about Namespace which is the core concept used by Docker.

Before talking about Namespaces in Linux, it is very important to know that what namespaces actually is?

Let’s take an example, We have two people with the same first name Abhishek Dubey and Abhishek Rawat but we can differentiate them on the basis of their surname Dubey and Rawat. So you can think surname as a namespace.

In Linux, namespaces are used to provide isolation for objects from other objects. So that anything will happen in namespaces will remain in that particular namespace and doesn’t affect other objects of other namespaces. For example:- we can have the same type of objects in different namespaces as they are isolated from each other.

In short, due to isolation, namespaces limits how much we can see.

Now you would be having a good conceptual idea of Namespace let’s try to understand them in the context of Linux Operating System.

Linux Namespaces

Linux namespace forms a single hierarchy, with all processes and that is init. Usually, privileged processes and services can trace or kill other processes. Linux namespaces provide the functionality to have many hierarchies of processes with their own “subtrees”, such that, processes in one subtree can’t access or even know those of another.
A namespace wraps a global system resource (For ex:- PID) using the abstraction that makes it appear to processes within the namespace that they have, using their own isolated instance of the said resource.

In the above figure, we have a process named 1 which is the first PID and from 1 parent process there are new PIDs are generated just like a tree. If you see the 6th PID in which we are creating a subtree, there actually we are creating a different namespace. In the new namespace, 6th PID will be its first and parent PID. So the child processes of 6th PID cannot see the parent process or namespace but the parent process can see the child PIDs of the subtree.

Let’s take PID namespace as an example to understand it more clearly. Without namespace, all processes descend(move downwards) hierarchically from First PID i.e. init. If we create PID namespace and run a process in it, the process becomes the First PID in that namespace. In this case, we wrap a global system resource(PID). The process that creates the namespace still remains in the parent namespace but makes it child for the root of the new process tree.
This means that the processes within the new namespace cannot see the parent process but the parent process can see the child namespace process. 
I hope you have got a clear understanding of Namespaces concepts & what purpose they serve in a Linux OS. The next blog of this series will talk about how we use namespace to restrict usage of system resources such as network, mounts, cgroups…

    Forward and Reverse Proxy

    Overview

    Before talking about forward proxy and reverse proxy let’s talk about what is the meaning of proxy.
    Basically proxy means someone or something is acting on behalf of someone.
    In the technical realm, we are talking about one server is acting behalf of the other servers.

    In this blog, we will talk about web proxies. So basically we have two types of web proxies:-

    • Forward Proxy
    • Reverse Proxy
    The forward proxy is used by the client, for example:- web browser, whereas reverse proxy is used by the server such as web server.

    Forward Proxy

    In Forward Proxy, proxy retrieves data from another website on the behalf of original requestee. For example:- If an IP is blocked for visiting a particular website then the person(client) can use the forward proxy to hide the real IP of the client and can visit the website easily.
    Let’s take another example to understand it more clearly. For example, we have 3 server
    Client                      -> Your computer from which you are sending the request
    Proxy Site               -> The proxy server, proxy.example.com
    Main Web server    -> The website you want to see
    Normally connection can happen like this 
    In the forward proxy, the connection will happen like this
    So here the proxy client is talking to the main web server on the behalf of the client.
    The forward proxy also acts as a cache server. For example:- If the content is downloading multiple times the proxy can cache the content on the server so next time when another server is downloading the same content, the proxy will send the content that is previously stored on the server to another server. 

     Reverse Proxy

    The reverse proxy is used by the server to maintain load and to achieve high availability. A website may have multiple servers behind the reverse proxy. The reverse proxy takes requests from the client and forwards these requests to the web servers. Some tools for reverse proxy are Nginx, HaProxy.
    So let’s take the similar example as the forward proxy
    Client                      -> Your computer from which you are sending the request
    Proxy Site               -> The proxy server, proxy.example.com
    Main Web server    -> The website you want to see
    Here it is better to restrict the direct access to the Main Web Server and force the requests or requestors to go through Proxy Server first. So data is being retrieved by Proxy Server on the behalf of Client.
    • So the difference between Forward Proxy and Reverse Proxy is that in Reverse Proxy the user doesn’t know he is accessing Main Web Server, because of the user only communicate with Proxy Server.
    • The Main Web Server is invisible for the user and only Reverse Proxy Server is visible. The user thinks that he is communicating with Main Web Server but actually Reverse Proxy Server is forwarding the requests to the Main Web Server.

    Prometheus Overview and Setup

    Overview

    Prometheus is an opensource monitoring solution that gathers time series based numerical data. It is a project which was started by Google’s ex-employees at SoundCloud. 

    To monitor your services and infra with Prometheus your service needs to expose an endpoint in the form of port or URL. For example:- {{localhost:9090}}. The endpoint is an HTTP interface that exposes the metrics.

    For some platforms such as Kubernetes and skyDNS Prometheus act as directly instrumented software that means you don’t have to install any kind of exporters to monitor these platforms. It can directly monitor by Prometheus.

    One of the best thing about Prometheus is that it uses a Time Series Database(TSDB) because of that you can use mathematical operations, queries to analyze them. Prometheus uses SQLite as a database but it keeps the monitoring data in volumes.

    Pre-requisites

    • A CentOS 7 or Ubuntu VM
    • A non-root sudo user, preferably one named prometheus

    Installing Prometheus Server

    First, create a new directory to store all the files you download in this tutorial and move to it.

    mkdir /opt/prometheus-setup
    cd /opt/prometheus-setup
    Create a user named “prometheus”

    useradd prometheus

    Use wget to download the latest build of the Prometheus server and time-series database from GitHub.


    wget https://github.com/prometheus/prometheus/releases/download/v2.0.0/prometheus-2.0.0.linux-amd64.tar.gz
    
    The Prometheus monitoring system consists of several components, each of which needs to be installed separately.

    Use tar to extract prometheus-2.0.0.linux-amd64.tar.gz:

    tar -xvzf ~/opt/prometheus-setup/prometheus-2.0.0.linux-amd64.tar.gz .
    
     Place your executable file somewhere in your PATH variable, or add them into a path for easy access.

    mv prometheus-2.0.0.linux-amd64  prometheus
    sudo mv  prometheus/prometheus  /usr/bin/
    sudo chown prometheus:prometheus /usr/bin/prometheus
    sudo chown -R prometheus:prometheus /opt/prometheus-setup/
    mkdir /etc/prometheus
    mv prometheus/prometheus.yml /etc/prometheus/
    sudo chown -R prometheus:prometheus /etc/prometheus/
    prometheus --version
      

    You should see the following message on your screen:

      prometheus,       version 2.0.0 (branch: HEAD, revision: 0a74f98628a0463dddc90528220c94de5032d1a0)
      build user:       root@615b82cb36b6
      build date:       20171108-07:11:59
      go version:       go1.9.2
    Create a service for Prometheus 

    sudo vi /etc/systemd/system/prometheus.service
    [Unit]
    Description=Prometheus
    
    [Service]
    User=prometheus
    ExecStart=/usr/bin/prometheus --config.file /etc/prometheus/prometheus.yml --storage.tsdb.path /opt/prometheus-setup/
    
    [Install]
    WantedBy=multi-user.target
    systemctl daemon-reload
    
    systemctl start prometheus
    
    systemctl enable prometheus

    Installing Node Exporter


    Prometheus was developed for the purpose of monitoring web services. In order to monitor the metrics of your server, you should install a tool called Node Exporter. Node Exporter, as its name suggests, exports lots of metrics (such as disk I/O statistics, CPU load, memory usage, network statistics, and more) in a format Prometheus understands. Enter the Downloads directory and use wget to download the latest build of Node Exporter which is available on GitHub.

    Node exporter is a binary which is written in go which monitors the resources such as cpu, ram and filesystem. 

    wget https://github.com/prometheus/node_exporter/releases/download/v0.15.1/node_exporter-0.15.1.linux-amd64.tar.gz
    

    You can now use the tar command to extract : node_exporter-0.15.1.linux-amd64.tar.gz

    tar -xvzf node_exporter-0.15.1.linux-amd64.tar.gz .
    
    mv node_exporter-0.15.1.linux-amd64 node-exporter

    Perform this action:-

    mv node-exporter/node_exporter /usr/bin/
    

    Running Node Exporter as a Service

    Create a user named “prometheus” on the machine on which you are going to create node exporter service.

    useradd prometheus

    To make it easy to start and stop the Node Exporter, let us now convert it into a service. Use vi or any other text editor to create a unit configuration file called node_exporter.service.


    sudo vi /etc/systemd/system/node_exporter.service
    
    This file should contain the path of the node_exporter executable, and also specify which user should run the executable. Accordingly, add the following code:

    [Unit]
    Description=Node Exporter
    
    [Service]
    User=prometheus
    ExecStart=/usr/bin/node_exporter
    
    [Install]
    WantedBy=default.target

    Save the file and exit the text editor. Reload systemd so that it reads the configuration file you just created.


    sudo systemctl daemon-reload
    At this point, Node Exporter is available as a service which can be managed using the systemctl command. Enable it so that it starts automatically at boot time.

    sudo systemctl enable node_exporter.service
    You can now either reboot your server or use the following command to start the service manually:
    sudo systemctl start node_exporter.service
    Once it starts, use a browser to view Node Exporter’s web interface, which is available at http://your_server_ip:9100/metrics. You should see a page with a lot of text:

    Starting Prometheus Server with a new node

    Before you start Prometheus, you must first edit a configuration file for it called prometheus.yml.

    vim /etc/prometheus/prometheus.yml
    Copy the following code into the file.

    # my global configuration which means it will applicable for all jobs in file
    global:
      scrape_interval:     15s # Set the scrape interval to every 15 seconds. Default is every 1 minute. scrape_interval should be provided for scraping data from exporters 
      evaluation_interval: 15s # Evaluate rules every 15 seconds. The default is every 1 minute. Evaluation interval checks at particular time is there any update on alerting rules or not.
    
    # Load rules once and periodically evaluate them according to the global 'evaluation_interval'. Here we will define our rules file path 
    #rule_files:
    #  - "node_rules.yml"
    #  - "db_rules.yml"
    
    # A scrape configuration containing exactly one endpoint to scrape: In the scrape config we can define our job definitions
    scrape_configs:
      # The job name is added as a label `job=` to any timeseries scraped from this config.
      - job_name: 'node-exporter'
        # metrics_path defaults to '/metrics'
        # scheme defaults to 'http'. 
        # target are the machine on which exporter are running and exposing data at particular port.
        static_configs:
          - targets: ['localhost:9100']
    After adding configuration in prometheus.yml. We should restart the service by

    systemctl restart prometheus
    This creates a scrape_configs section and defines a job called a node. It includes the URL of your Node Exporter’s web interface in its array of targets. The scrape_interval is set to 15 seconds so that Prometheus scrapes the metrics once every fifteen seconds. You could name your job anything you want, but calling it “node” allows you to use the default console templates of Node Exporter.
    Use a browser to visit Prometheus’s homepage available at http://your_server_ip:9090. You’ll see the following homepage. Visit http://your_server_ip:9090/consoles/node.html to access the Node Console and click on your server, localhost:9100, to view its metrics.

    Logstash Timestamp

    Introduction

    A few days back I encountered with a simple but painful issue. I am using ELK to parse my application logs  and generate some meaningful views. Here I met with an issue which is, logstash inserts my logs into elasticsearch as per the current timestamp, instead of the actual time of log generation.
    This creates a mess to generate graphs with correct time value on Kibana.
    So I had a dig around this and found a way to overcome this concern. I made some changes in my logstash configuration to replace default time-stamp of logstash with the actual timestamp of my logs.

    Logstash Filter

    Add following piece of code in your  filter plugin section of logstash’s configuration file, and it will make logstash to insert logs into elasticsearch with the actual timestamp of your logs, besides the timestamp of logstash (current timestamp).
     
    date {
      locale => "en"
      timezone => "GMT"
      match => [ "timestamp", "yyyy-mm-dd HH:mm:ss +0000" ]
    }
    
    In my case, the timezone was GMT  for my logs. You need to change these entries  “yyyy-mm-dd HH:mm:ss +0000”  with the corresponding to the regex for actual timestamp of your logs.

    Description

    Date plugin will override the logstash’s timestamp with the timestamp of your logs. Now you can easily adjust timezone in kibana and it will show your logs on correct time.
    (Note: Kibana adjust UTC time with you bowser’s timezone)