The closer you think you are, the less you’ll actually see

I hope you have seen the movie Now you see me, it has a famous quote The closer you think you are, the less you’ll actually see. Well, this blog is not about this movie but how I got stuck into an issue, because I was not paying attention and looking at the things closely and seeing less hence not able to resolve the issue.

There is a lot happening in today’s DevOps world. And HashiCorp has emerged out to be a big player in this game. Terraform is one of the open source tools to manage infrastructure as code. It plays well with most of the cloud provider. But with all these continuous improvements and enhancements there comes a possibility of issues as well. Below article is about such a scenario. And in case you have found yourself in the same trouble. You are lucky to reach the right page.
I was learning terraform and performing a simple task to launch an Ubuntu EC2 instance in us-east-1 region. For which I required the AMI Id, which I copied from the AWS console as shown in below screenshot.

Once I got the AMI Id, I tried to create the instance using terraform, below is the screenshot of the code

provider “aws” {
  region     = “us-east-1”
  access_key = “XXXXXXXXXXXXXXXXXX”
  secret_key = “XXXXXXXXXXXXXXXXXXX”
}
resource “aws_instance” “sandy” {
        ami = “ami-036ede09922dadc9b
        instance_type = “t2.micro”
        subnet_id = “subnet-0bf4261d26b8dc3fc”
}
I was expecting to see the magic of Terraform but what I got below ugly error.

Terraform was not allowing to spin up the instance. I tried couple of things which didn’t work. As you can see the error message didn’t give too much information. Finally, I thought of giving it a try by  doing same task via AWS web console. I searched for the same ubuntu AMI and selected the image as shown below. Rest of the things, I kept to default. And well, this time it got launched.

And it confused me more. Through console, it was working fine but while using Terraform it says not allowed. After a lot of hair pulling finally, I found the culprit which is a perfect example of how overlooking small things can lead to blunder.

Culprit

While copying the AMI ID from AWS console, I had copied the 64-bit (ARM) AMI ID. Please look carefully, the below screenshot

But while creating it through console I was selecting the default configuration which by is 64-bit(x86). Look at the below screenshot.

To explain it further, I tried to launch the VM with 64-bit (ARM) manually. And while selecting the AMI, I selected the 64-bit (ARM).

And here is the culprit. 64-bit(ARM) only supports a1 instance type

Conclusion

While launching the instance with the terraform, I tried using 64-bit (ARM) AMI ID mistakenly, primarily because for same AMI there are 2 AMI IDs and it is not very visible to eyes unless you pay special attention.

So folks, next time choosing an AMI ID keep it in mind what type of AMI you are selecting. It will save you a lot of time.

Migrate your data between various Databases

Data Migration Service

 
Have you ever thought about migrating your production database from one platform to another
and dropped this idea later, because it was too risky, you were not ready to
bare a downtime?
If yes, then please pay attention because this is what we are going to perform
in this article.
A few days back we’re trying to migrate our production MySQL RDS from AWS to GCP,  SQL, and we had to migrate data without downtime, accurate and
real-time and that too without the help
of any Database Administrator.
 
After doing a bit research and evaluating few services we finally started working on AWS DMS (Data Migration Service) and figured out this is a great service to migrate a
different kind of data.
 
You can migrate your data to and from the most widely used commercial and open-source databases, and database platforms. Databases like Oracle, Microsoft SQL Server, and
PostgreSQL, MongoDB.
The source database remains fully operational during the migration,
The service supports
homogeneous migrations such as Oracle to Oracle,
and also heterogeneous migrations between different database platforms.
 

Let’s discuss some important features of AWS DMS:

 
  • Migrates the database securely, quickly and accurately.
  • No downtime required, works as schema converter as well.
  • Supports various type or database like MySQL, MongoDB, PSQL etc.
  • Migrates real-time data also synchronize ongoing changes.
  • Data validation is available to verify database.
  • Compatible with a long range of database platforms like RDS, Google SQL, on-premises etc.
  • Inexpensive (Pricing is based on the compute resources used during the migration process).
This is a typical migration scenario.
Let’s perform step by step migration:

Note: We’ve performed migration from AWS RDS
to GCP SQL, you can choose database source and
destination as per your requirement.

  1. Create replication instance:
    A replication instance initiates the connection between the source and target databases, transfers the data, cache any changes that occur on the source database during the initial data load.
    Use the fields to below to configure the parameters of your new replication instance including network and security information, encryption details, select instance class as per requirement.

    After completion, all mandatory fields click the next tab, and you will be redirected
    to Replication Instance tab.
    Grab a coffee quickly while the instance is getting ready.

    Hope you are ready with your coffee because the instance is ready now.


  2. Now we are to create two endpoints “Source” and “Target” 2.1 Create Source Endpoint:

    Click on “Run test” tab after completing all fields, make sure your Replication instance IP is whitelisted
    under security group. 2.2 Create Target Endpoint


    Click on “Run test” tab again after completing all fields, make sure your Replication instance IP is whitelisted under target DB authorization.
    Now we’ve ready Replication Instance, Source Endpoint, and Target Endpoint.
  3. Finally, we’ll create a “Replication Task” to start replication.
    Fill the fields like:
  • Task Name: any name
  • Replication Instance: The instance we’ve created above
  • Source Endpoint: The source database
  • Target Endpoint: The target database
  • Migration Type: Here I choose “Migration existing data and replication
    ongoing” because we needed ongoing changes.
 
4. Verify the task status now.
Once all the fields are completed click on the “Create task” and you will be
redirected to “Tasks”
Tab.
Check your task status
 
The task has been successfully completed now, you can verify the inserts tabs and validation tab,
The migration is done successfully if Validation State is “Validated” that means migration has been performed successfully.

Git Inside Out

Git Inside-Out
Man Wearing Black and White Stripe Shirt Looking at White Printer Papers on the Wall

Git is basically a file-system where you can retrieve your content through addresses. It simply means that you can insert any kind of data into git for which Git will hand you back a unique key you can use later to retrieve that content. We would be learning #gitinsideout through this blog

The Git object model has three types: blobs (for files), trees (for folder) and commits. 

Objects are immutable (they are added but not changed) and every object is identified by its unique SHA-1 hash
A blob is just the contents of a file. By default, every new version of a file gets a new blob, which is a snapshot of the file (not a delta like many other versioning systems).
A tree is a list of references to blobs and trees.
A commit is a reference to a tree, a reference to parent commit(s) and some decoration (message, author).

Then there are branches and tags, which are typically just references to commits.

Git stores the data in our .git/objects directory. After initialising a git repository, it automatically creates .git/objects/pack and .git/objects/info with no regular file. After pushing some files, it would reflect in the .git/objects/ folder

OBJECT Blob

blob stores the content of a file and we can check its content by command

git cat-file -p

or git show

OBJECT Tree

A tree is a simple object that has a bunch of pointers to blobs and other trees – it generally represents the contents of a directory or sub-directory.

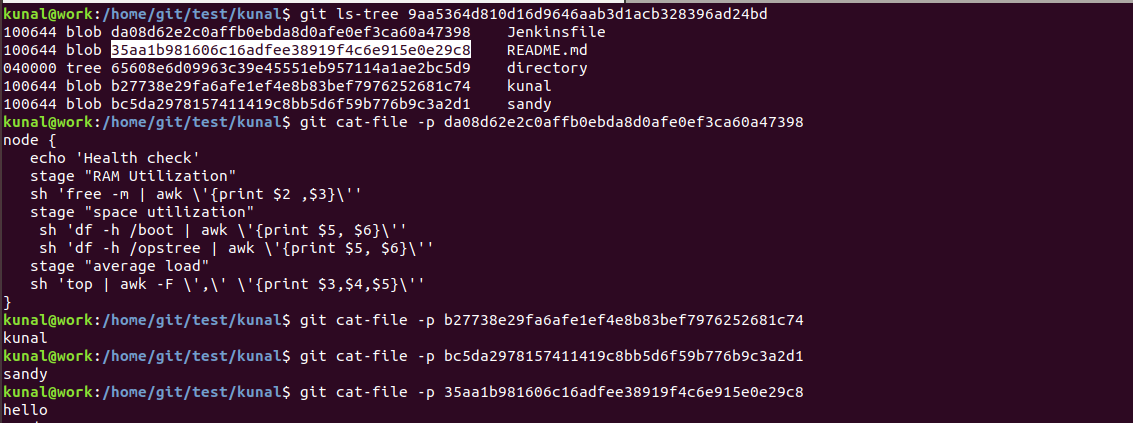
We can use git ls-tree to list the content of the given tree object

OBJECT Commit

The “commit” object links a physical state of a tree with a description of how we got there and why.

A commit is defined by tree, parent, author, committer, comment

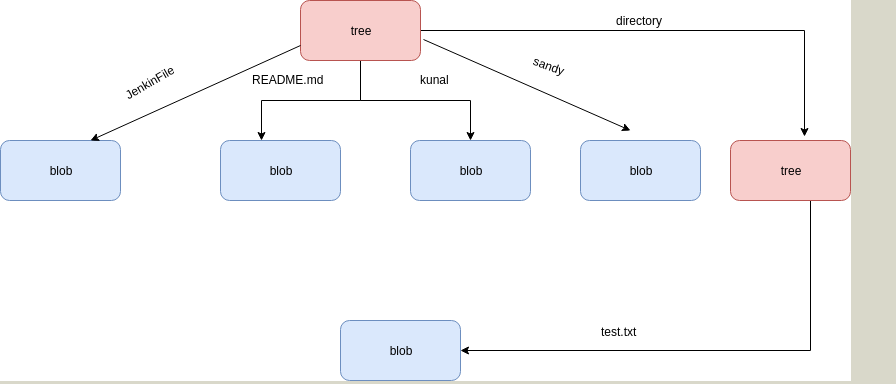
All three objects ( blob,Tree,Commit) are explained in details with the help of a pictorial diagram.

Often we make changes to our code and push it to SCM. I was doing it once and made multiple changes, I was thinking it would be great if I could see the details of changes through local repository itself instead to go to a remote repository server. That pushed me to explore Git more deeply.

I just created a local remote repository with the help of git bare repository. Made some changes and tracked those changes(type, content, size etc).

Below example will help you understand the concept behind it.

Suppose we have cloned a repository named kunal:

Inside the folder where we have cloned the repository, go to the folder kunal then:

cd kunal/.git/

I have added content(hello) to readme.md and made many changes into the same repository as:

adding README.md

updating Readme.md

adding 2 files modifying one

pull request

commit(adding directory).

Go to the refer folder inside .git and take the SHA value for the master head:

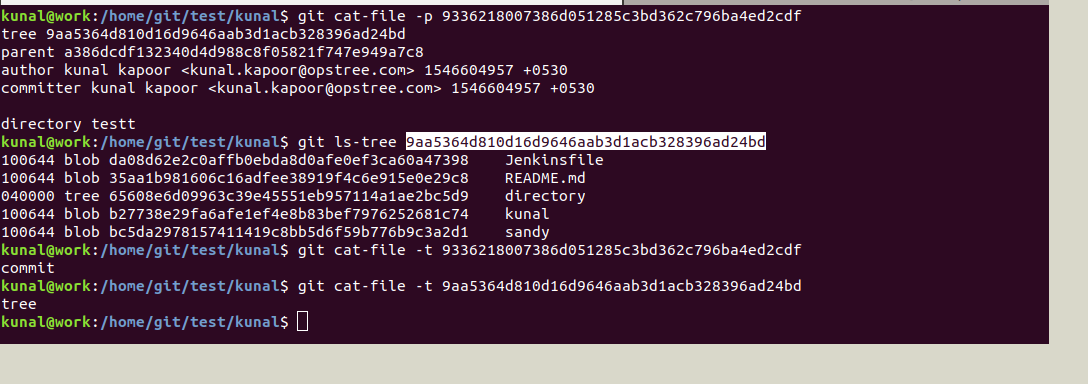
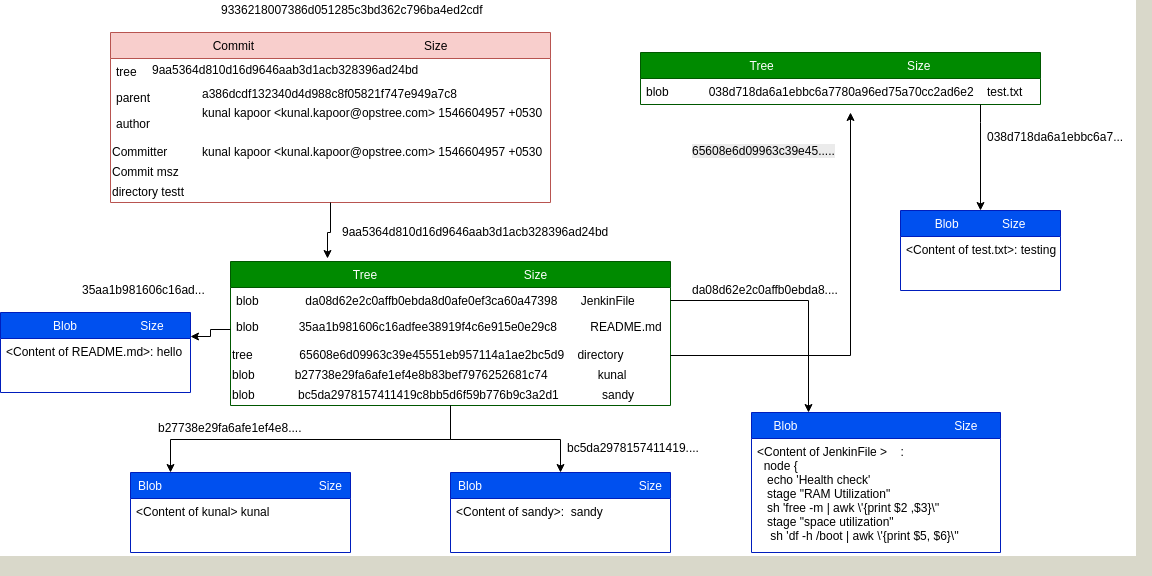
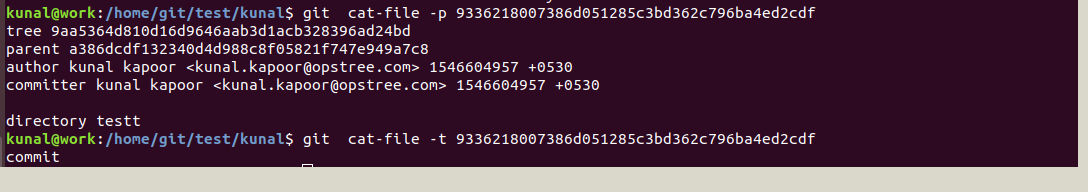
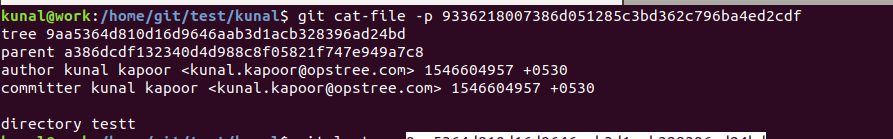
This commit object we can explore further with the help of cat-file which will show the type and content of tree and commit object:

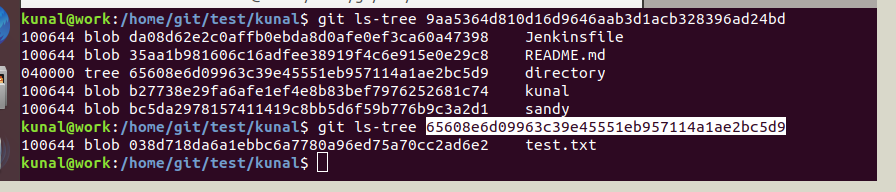
Now we can see a tree object inside the tree object. Further, we can see the details for the tree object which in turn contains a blob object as below:

Below is the pictorial representation for the same:

More elaborated representation for the same :

Below are the commands for checking the content, type and size of objects( blob, tree and commit)

kunal@work:/home/git/test/kunal# cat README.md
hello

We can find the details of objects( size,type,content) with the help of #git cat-file

git-cat-file:- Provide content, type or size information for repository objects

You an verify the content of commit object and its type with git cat-file as below:

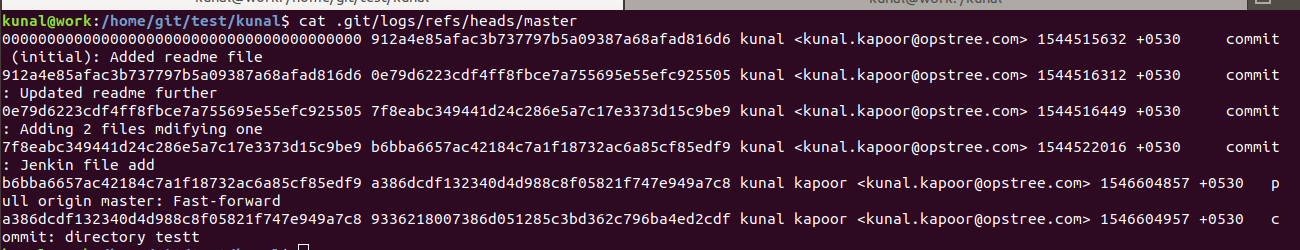
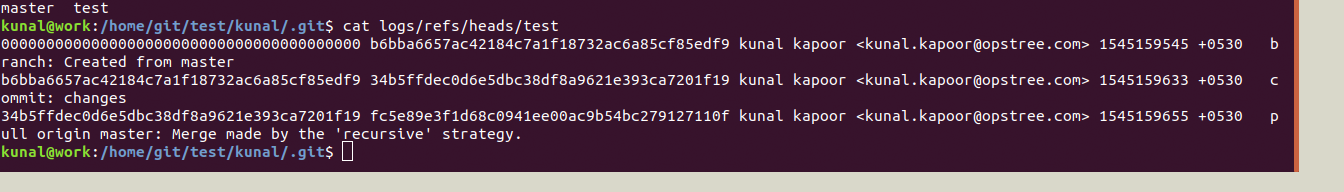
kunal@work:/home/git/test/kunal/.git # cat logs/refs/heads/master

Checking the content of a blob object(README.md, kunal and sandy)

As we can see first one is adding read me , so it is giving null parent(00000…000) and its unique SHA-1 is 912a4e85afac3b737797b5a09387a68afad816d6

Below are the details that we can fetch from above SHA-1 with the help of git cat-file :

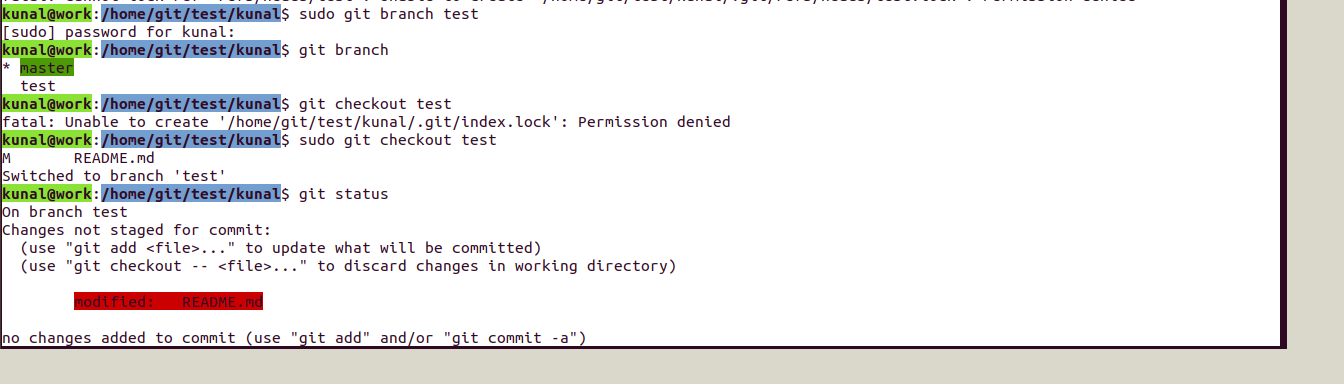
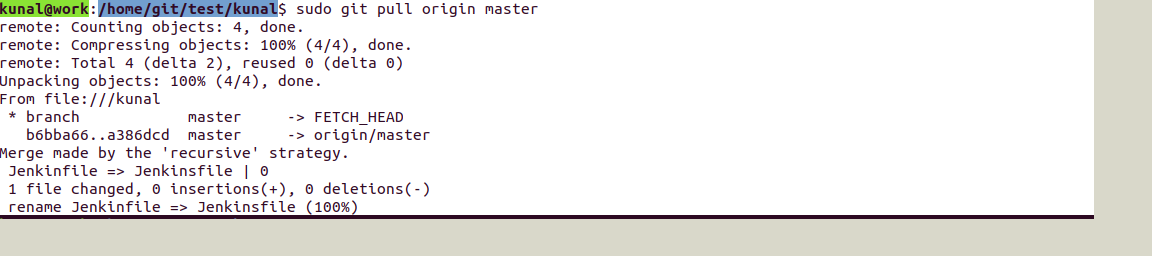
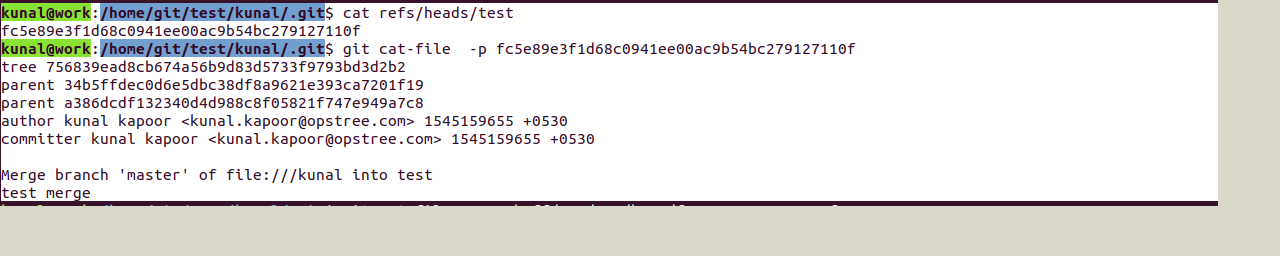
Consider one example of merge:

Created a test branch and made changes and merged it to master.

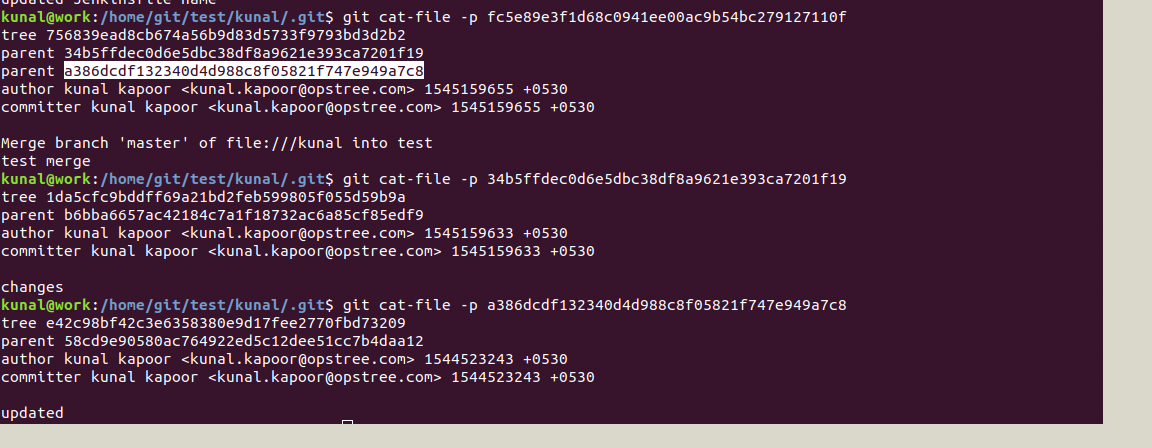
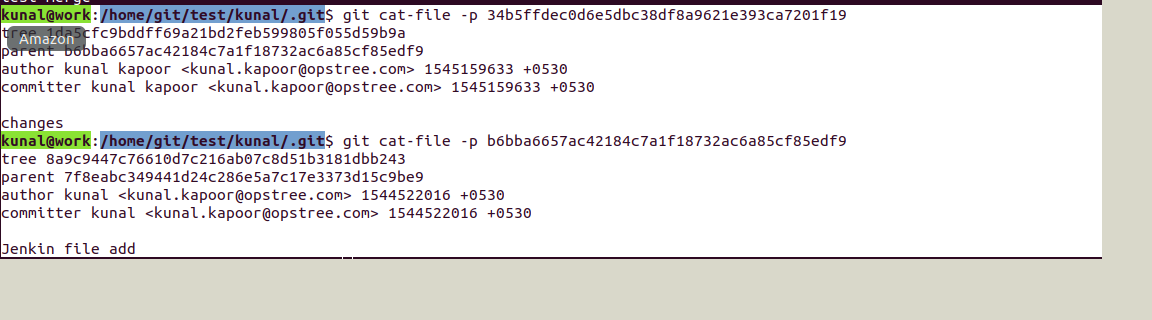
Here you can notice we have two parents because of a merge request

You can further see the content, size, type of repository #gitobjects like:

Summary

This is pretty lengthy article but I’ve tried to make it as transparent and clear as possible. Once you work through the article and understand all concepts I showed here you will be able to work with Git more effectively.

This explanation gives the details regarding tree data structure and internal storage of objects. You can check the content (differences/commits)of the files through local .git repository which stores each object with unique  SHA  hash. This would clear basically the internal working of git.
Hopefully, this blog would help you in understanding the git inside out and helps in troubleshooting things related to git.

Log Parsing of Windows Servers on Instance Termination

Introduction

Logs play a critical role in any application or system. They provide deep visibility into what the application is doing, how requests are processed, and what caused an error. Depending on how logging is configured, logs may contain transaction history, timestamps, request details, and even financial information such as debits or credits.

In enterprise environments, applications usually run across multiple hosts. Managing logs across hundreds of servers can quickly become complex. Debugging issues by manually searching log files on multiple instances is time consuming and inefficient. This is why centralizing logs is considered a best practice.

Recently, I encountered a common challenge in AWS environments where application logs need to be retained from instances running behind an Auto Scaling Group. This blog explains a practical solution to ensure logs are preserved even when instances are terminated.

Problem Scenario

Assume your application writes logs to the following directory on a Windows instance.

C:\Source\Application\web\logs

Traffic to the application is variable. At low traffic, two EC2 instances may be sufficient. During peak traffic, the Auto Scaling Group may scale out to twenty or more instances.

When traffic increases, new EC2 instances are launched and logs are generated normally. However, when traffic drops, Auto Scaling triggers scale-down events and terminates instances. When an instance is terminated, all logs stored locally on that instance are lost.

This makes post-incident debugging and auditing difficult.

Solution Overview

The goal is to synchronize logs from terminating EC2 instances before they are fully removed.

This solution uses AWS services to trigger a PowerShell script through AWS Systems Manager at instance termination time. The script archives logs and uploads them to an S3 bucket with identifying information such as IP address and date.

To achieve this, two prerequisites are required.

  1. Systems Manager must be able to communicate with EC2 instances

  2. EC2 instances must have permission to write logs to Amazon S3

Environment Used

For this setup, the following AMI was used.

 
Microsoft Windows Server 2012 R2 Base
AMI ID: ami-0f7af6e605e2d2db5

Step 1 Configuring Systems Manager Access on EC2

SSM Agent is installed by default on Windows Server 2016 and on Windows Server 2003 to 2012 R2 AMIs published after November 2016.

For older Windows AMIs, EC2Config must be upgraded and SSM Agent installed alongside it.

The following PowerShell script upgrades EC2Config, installs SSM Agent, and installs AWS CLI.
Use this script only for instructional and controlled environments.

PowerShell Script to Install Required Components

 
# Create temporary directory if not present
if (!(Test-Path -Path C:\Tmp)) {
New-Item -ItemType Directory -Path C:\Tmp
}

Set-Location C:\Tmp

# Download installers
Invoke-WebRequest "https://s3.ap-south-1.amazonaws.com/asg-termination-logs/Ec2Install.exe" -OutFile Ec2Config.exe
Invoke-WebRequest "https://s3.amazonaws.com/ec2-downloads-windows/SSMAgent/latest/windows_amd64/AmazonSSMAgentSetup.exe" -OutFile ssmagent.exe
Invoke-WebRequest "https://s3.amazonaws.com/aws-cli/AWSCLISetup.exe" -OutFile awscli.exe

# Install EC2Config
Start-Process C:\Tmp\Ec2Config.exe -ArgumentList "/Ec /S /v/qn" -Wait
Start-Sleep -Seconds 20

# Install AWS CLI
Start-Process C:\Tmp\awscli.exe -ArgumentList "/Ec /S /v/qn" -Wait
Start-Sleep -Seconds 20

# Install SSM Agent
Start-Process C:\Tmp\ssmagent.exe -ArgumentList "/Ec /S /v/qn" -Wait
Start-Sleep -Seconds 10

Restart-Service AmazonSSMAgent

Remove-Item C:\Tmp -Recurse -Force

IAM Role for Systems Manager

The EC2 instance must have an IAM role that allows it to communicate with Systems Manager.

Attach the following managed policy to the instance role.

 
AmazonEC2RoleforSSM

Once attached, the role should appear under the instance IAM configuration.

index

Step 2 Allowing EC2 to Write Logs to S3

The EC2 instance also needs permission to upload logs to S3.

Attach the following policy to the same IAM role.

 
AmazonS3FullAccess

In production environments, it is recommended to scope this permission to a specific bucket.

index

PowerShell Script for Log Archival and Upload

Save the following script as shown below.

 
C:\Scripts\termination.ps1

This script performs the following actions.

  • Creates a date-stamped directory

  • Archives application logs

  • Uploads the archive to an S3 bucket

Log Synchronization Script

 
$Date = Get-Date -Format yyyy-MM-dd
$InstanceName = "TerminationEc2"
$LocalIP = Invoke-RestMethod -Uri "http://169.254.169.254/latest/meta-data/local-ipv4"

$WorkDir = "C:\Users\Administrator\workdir\$InstanceName-$LocalIP-$Date\$Date"

if (Test-Path $WorkDir) {
Remove-Item $WorkDir -Recurse -Force
}

New-Item -ItemType Directory -Path $WorkDir

$SourcePathWeb = "C:\Source\Application\web\logs"
$DestFileWeb = "$WorkDir\logs.zip"

Add-Type -AssemblyName "System.IO.Compression.FileSystem"
[System.IO.Compression.ZipFile]::CreateFromDirectory($SourcePathWeb, $DestFileWeb)

& "C:\Program Files\Amazon\AWSCLI\bin\aws.cmd" s3 cp `
"C:\Users\Administrator\workdir" `
"s3://terminationec2" `
--recursive `
--region us-east-1

Once executed manually, the script should complete successfully and upload logs to the S3 bucket.

index

index

Running the Script Using Systems Manager

To automate execution, run this script using Systems Manager Run Command.

Select the target instance and choose the document.

 
AWS-RunPowerShellScript

Configure the following.

 
Commands: .\termination.ps1
Working Directory: C:\Scripts
Execution Timeout: 3600

Auto Scaling Group Preparation

Ensure the AMI used by the Auto Scaling Group includes all the above configurations.

Create an AMI from a configured EC2 instance and update the launch configuration or launch template.

For this tutorial, the Auto Scaling Group is named.

 
group_kaien

Configuring CloudWatch Event Rule

Create a CloudWatch Event rule to trigger when an instance is terminated.

Event Pattern

 
{
"source": ["aws.autoscaling"],
"detail-type": [
"EC2 Instance Terminate Successful",
"EC2 Instance-terminate Lifecycle Action"
],
"detail": {
"AutoScalingGroupName": ["group_kaien"]
}
}
 
index

Event Target Configuration

Set the target as Systems Manager Run Command.

 
Document: AWS-RunPowerShellScript
Target: Instance ID
Command: .\termination.ps1
Working Directory: C:\Scripts

This ensures that whenever an instance is terminated, the PowerShell script runs and synchronizes logs to S3 before shutdown.

index

Validation

Trigger scale-out and scale-down events by adjusting Auto Scaling policies.

When instances are terminated, logs should appear in the S3 bucket with correct date and instance identifiers.

index

Conclusion

This setup ensures that application logs are safely preserved even when EC2 instances are terminated by an Auto Scaling Group. Logs are archived with proper timestamps and instance information, making debugging and auditing much easier.

With this approach, log retention is automated, reliable, and scalable for enterprise AWS environments.

Stay tuned for more practical infrastructure solutions.

Prometheus Overview and Setup

Overview

Prometheus is an opensource monitoring solution that gathers time series based numerical data. It is a project which was started by Google’s ex-employees at SoundCloud. 

To monitor your services and infra with Prometheus your service needs to expose an endpoint in the form of port or URL. For example:- {{localhost:9090}}. The endpoint is an HTTP interface that exposes the metrics.

For some platforms such as Kubernetes and skyDNS Prometheus act as directly instrumented software that means you don’t have to install any kind of exporters to monitor these platforms. It can directly monitor by Prometheus.

One of the best thing about Prometheus is that it uses a Time Series Database(TSDB) because of that you can use mathematical operations, queries to analyze them. Prometheus uses SQLite as a database but it keeps the monitoring data in volumes.

Pre-requisites

  • A CentOS 7 or Ubuntu VM
  • A non-root sudo user, preferably one named prometheus

Installing Prometheus Server

First, create a new directory to store all the files you download in this tutorial and move to it.

mkdir /opt/prometheus-setup
cd /opt/prometheus-setup
Create a user named “prometheus”

useradd prometheus

Use wget to download the latest build of the Prometheus server and time-series database from GitHub.


wget https://github.com/prometheus/prometheus/releases/download/v2.0.0/prometheus-2.0.0.linux-amd64.tar.gz
The Prometheus monitoring system consists of several components, each of which needs to be installed separately.

Use tar to extract prometheus-2.0.0.linux-amd64.tar.gz:

tar -xvzf ~/opt/prometheus-setup/prometheus-2.0.0.linux-amd64.tar.gz .
 Place your executable file somewhere in your PATH variable, or add them into a path for easy access.

mv prometheus-2.0.0.linux-amd64  prometheus
sudo mv  prometheus/prometheus  /usr/bin/
sudo chown prometheus:prometheus /usr/bin/prometheus
sudo chown -R prometheus:prometheus /opt/prometheus-setup/
mkdir /etc/prometheus
mv prometheus/prometheus.yml /etc/prometheus/
sudo chown -R prometheus:prometheus /etc/prometheus/
prometheus --version
  

You should see the following message on your screen:

  prometheus,       version 2.0.0 (branch: HEAD, revision: 0a74f98628a0463dddc90528220c94de5032d1a0)
  build user:       root@615b82cb36b6
  build date:       20171108-07:11:59
  go version:       go1.9.2
Create a service for Prometheus 

sudo vi /etc/systemd/system/prometheus.service
[Unit]
Description=Prometheus

[Service]
User=prometheus
ExecStart=/usr/bin/prometheus --config.file /etc/prometheus/prometheus.yml --storage.tsdb.path /opt/prometheus-setup/

[Install]
WantedBy=multi-user.target
systemctl daemon-reload

systemctl start prometheus

systemctl enable prometheus

Installing Node Exporter


Prometheus was developed for the purpose of monitoring web services. In order to monitor the metrics of your server, you should install a tool called Node Exporter. Node Exporter, as its name suggests, exports lots of metrics (such as disk I/O statistics, CPU load, memory usage, network statistics, and more) in a format Prometheus understands. Enter the Downloads directory and use wget to download the latest build of Node Exporter which is available on GitHub.

Node exporter is a binary which is written in go which monitors the resources such as cpu, ram and filesystem. 

wget https://github.com/prometheus/node_exporter/releases/download/v0.15.1/node_exporter-0.15.1.linux-amd64.tar.gz

You can now use the tar command to extract : node_exporter-0.15.1.linux-amd64.tar.gz

tar -xvzf node_exporter-0.15.1.linux-amd64.tar.gz .

mv node_exporter-0.15.1.linux-amd64 node-exporter

Perform this action:-

mv node-exporter/node_exporter /usr/bin/

Running Node Exporter as a Service

Create a user named “prometheus” on the machine on which you are going to create node exporter service.

useradd prometheus

To make it easy to start and stop the Node Exporter, let us now convert it into a service. Use vi or any other text editor to create a unit configuration file called node_exporter.service.


sudo vi /etc/systemd/system/node_exporter.service
This file should contain the path of the node_exporter executable, and also specify which user should run the executable. Accordingly, add the following code:

[Unit]
Description=Node Exporter

[Service]
User=prometheus
ExecStart=/usr/bin/node_exporter

[Install]
WantedBy=default.target

Save the file and exit the text editor. Reload systemd so that it reads the configuration file you just created.


sudo systemctl daemon-reload
At this point, Node Exporter is available as a service which can be managed using the systemctl command. Enable it so that it starts automatically at boot time.

sudo systemctl enable node_exporter.service
You can now either reboot your server or use the following command to start the service manually:
sudo systemctl start node_exporter.service
Once it starts, use a browser to view Node Exporter’s web interface, which is available at http://your_server_ip:9100/metrics. You should see a page with a lot of text:

Starting Prometheus Server with a new node

Before you start Prometheus, you must first edit a configuration file for it called prometheus.yml.

vim /etc/prometheus/prometheus.yml
Copy the following code into the file.

# my global configuration which means it will applicable for all jobs in file
global:
  scrape_interval:     15s # Set the scrape interval to every 15 seconds. Default is every 1 minute. scrape_interval should be provided for scraping data from exporters 
  evaluation_interval: 15s # Evaluate rules every 15 seconds. The default is every 1 minute. Evaluation interval checks at particular time is there any update on alerting rules or not.

# Load rules once and periodically evaluate them according to the global 'evaluation_interval'. Here we will define our rules file path 
#rule_files:
#  - "node_rules.yml"
#  - "db_rules.yml"

# A scrape configuration containing exactly one endpoint to scrape: In the scrape config we can define our job definitions
scrape_configs:
  # The job name is added as a label `job=` to any timeseries scraped from this config.
  - job_name: 'node-exporter'
    # metrics_path defaults to '/metrics'
    # scheme defaults to 'http'. 
    # target are the machine on which exporter are running and exposing data at particular port.
    static_configs:
      - targets: ['localhost:9100']
After adding configuration in prometheus.yml. We should restart the service by

systemctl restart prometheus
This creates a scrape_configs section and defines a job called a node. It includes the URL of your Node Exporter’s web interface in its array of targets. The scrape_interval is set to 15 seconds so that Prometheus scrapes the metrics once every fifteen seconds. You could name your job anything you want, but calling it “node” allows you to use the default console templates of Node Exporter.
Use a browser to visit Prometheus’s homepage available at http://your_server_ip:9090. You’ll see the following homepage. Visit http://your_server_ip:9090/consoles/node.html to access the Node Console and click on your server, localhost:9100, to view its metrics.