Thinking what the above diagram is all about. Once you are done with this blog, you will know exactly what it is. Till one month ago, I was of the opinion that Dynamic Inventory is a cool way of managing your AWS infrastructure as you don’t have to track your servers you just have to apply proper tags and Ansible Dynamic Inventory magically manages the inventory for you. Having said that I was not really comfortable using dynamic inventory as it was a black box I tried going through the Python script which was very cryptic & difficult to understand. If you are of the same opinion, then this blog is worth reading as I will try to demystify how things work in Dynamic Inventory and how you can implement your own Dynamic inventory using a very simple python script.
You can refer below article if you want to implement Dynamic inventory for your AWS infrastructure.
Now coming to what is dynamic inventory and how you can create one. You have to understand what Ansible accepts as an inventory file. Ansible expects a JSON in the below format. Below is the screenshot showing the bare minimum content which is required by Ansible. Ansible expects a dictionary of groups (each group having a list of group>hosts, and group variables in the group>vars dictionary), and a _meta dictionary that stores host variables for all hosts individually (inside a hostvars dictionary).
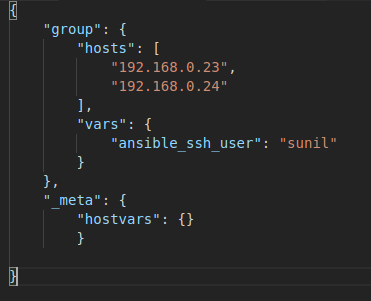
So as long as you can write a script which generates output in the above JSON format. Ansible won’t give you any trouble. So let’s start creating our own custom inventory.
I have created a python script customdynamicinventory.py which reads the data from input.csv and generates the JSON as mentioned above. For simplicity, I have kept my input.csv as simple as possible. You can find the code here:-
https://github.com/SUNIL23891YADAV/dynamicinventory.git
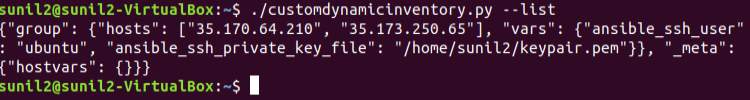
If you want to test it just clone the code and replace the IP, user and key details as per your environment in the input.csv file. To make sure that our python script is generating the output in standard JSON format as expected by Ansible. You can run ./customdynamicinventory.py –list
And it will generate the output in standard JSON format as shown in below screenshot.
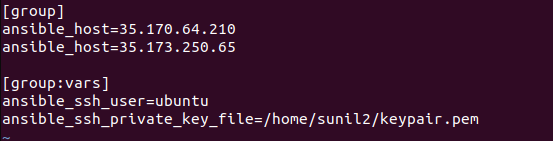
If you want to check how the static inventory file would have looked for the above scenario. You can refer to the below screenshot. It would have served the same purpose as the above dynamic inventory
Now to make sure your custom inventory is working fine. You can run
ansible all -i customdynamicinventory.py -m ping
It will try to ping all the hosts mentioned in the CSV. Let’s check it
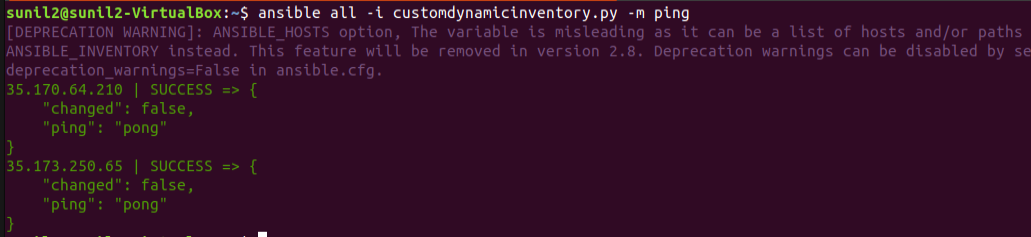
See it is working, that’s how easy it is.

Instead of a static CSV file, we can have a database where all the hosts and related details are getting updated dynamically. Then Ansible dynamic inventory script can use this database as an inventory source as long as it returns a JSON structure, mentioned in the first screenshot.