A few days back, when I was trying to install snoopy on my system, I came across an apt-key error. I have faced this error before as well but this time I tried to dig more into the issue. After all, we can’t let the same problem trouble us more than it has to.
When we run into such obstacles, they present good opportunities to break down and understand how things work. We must avail them and become better at our jobs. That being said, we do also have an outstanding community online to help provide solutions with reliable references without getting our hands dirty.
Let’s start with this screenshot of the error I encountered:
Hello everyone! If you are reading this blog, I assume that you have already gone through the first part of my blog. In case, you haven’t, I suggest you to go through the link before reading this blog.
Let’s recall the concept of the first part of this series with some simple principles :
D.R.Y(Don’t Repeat Yourself): Not to repeat the same process of writing and maintaining Kubernetes resources repeatedly for even the simplest of deployments.
Focus on what, not how: Helm is a package manager for Kubernetes that allows developers and operators to more easily, package, configure, and deploy applications and services onto the Kubernetes clusters.
In this part, we will be starting with Helm and will give a kick start so that by the end of this article we will be able to search & use publicly available Helm Charts of various software or application dependencies and install them on our K8s cluster.
Helm Glossary
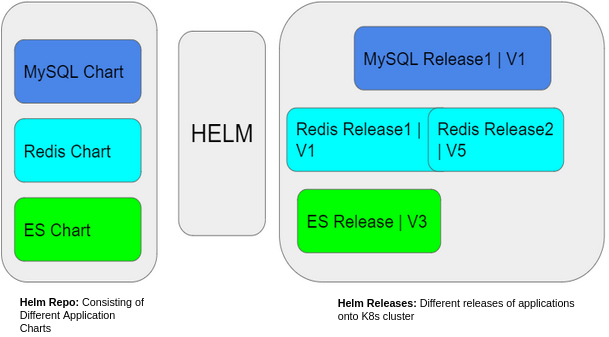
Helm Chart Repository: A repository is a place where packaged charts of an application can be collected and shared.
Helm Charts: Helm packages are called charts. It contains all the resource definitions that are necessary to run an application, tool, or service inside a K8s cluster.
Helm Release: A Helm release is an instance of a chart running in a K8s cluster.
Once you have Helm ready, we can add a chart repository. We can choose our desired one from the artifacts hub. Here we are going with Stable Library, adding the repo named as stable :
Additionally, after adding repo in our local system, we update the repo to get the latest information about charts from the respective chart repositories. And we can list out the repositories added to our system using $ helm repo list as shown above.
Removing added repositories in our system is as easy as adding them.
$ helm repo remove stable.
Once the repository has been added, Helm provides search functionality which gives the ability to search for Helm charts in the various places they can be stored including the Helm Hub and repositories. Here, we will be installing MySQL from the publicly available Helm Chart of the repo which has been added.
$ helm search repo stable
$ helm search repo mysql
As we all know, Helm saves us from writing all K8s resources for a package as it already comes with versioned, pre-configured application resources that can be deployed as one unit. But to see what all resources and environment values are configured for the application, we can check using :
$ helm template stable/mysql
$ helm show values stable/mysql
Now we are all set to install MySQL onto K8’s cluster and take a quick walk-through about Helm Release. To install a new package we use helm install command. At its simplest, it takes two arguments: A release name that we pick and the name of the chart that we want to install.
$ helm install mysqlapp stable/mysql
Additionally, to check the release of all the installed packages use $ helm ls as shown below.
The point of focus is on the Revision of the Release i.e; 1 as shown above. Here, we used the default configuration of the MySQL chart. Needless to say, we’d want to customize the chart with our preferred configuration most of the time and bring a new version of the application release. To achieve this, we simply use $ helm upgrade command. Here we are updating some default environment values of MySQL with our required ones.
To check user-provided values and the upgrade of our release, we can use $ helm get values mysqlapp and $ helm ls commands respectively. Also, here we see the revision value has been changed to 2 as shown above which will keep on incrementing with every upgrade.
And when it is time to uninstall a release from the cluster, we use the helm uninstall command:
$ helm uninstall mysqlapp
Finally, we can say that we are comfortable to get started with Helm and to install our first release using publicly available Helm Charts in our K8s cluster. At this point, we’d like to recommend our readers to install a couple of applications using these public Helm Charts and share their experience in the comment section.
This year’s pandemic has forced businesses all around the world to adopt a “remote-first” approach for executing daily operations. Although our lives have been greatly disrupted due to lockdown measures and economic impact, we have managed a balance in our social lives through online modes such as shopping, learning, messaging, gaming, and other activities.
Modern software design is also taking a remote-first mindset to ensure that users can collaborate and share information within each app, including the ability to interact with real-time data processing.
We are starting our journey to explore Kafka in this pandemic. Starting from “zero to hero“, this Kafka series will help you in understanding the Kafka concepts.
We have seen many security incidents. Any breach in security cause concern among enterprises. To be honest it not only concern them, it also gives birth to their nightmare, distrust and scepticism as organisation. The root cause of this distrust is improper implementation and configuration.
Opstree Security has started a new initiative where we rigorously analyse and implement CIS Benchmark of every tools being used today.
Are you tired of writing and maintaining K8s YAML manifests for all the required Kubernetes object? Or do you feel drowsy for even the simplest of deployments by writing at least 3 YAML manifests with duplicated and hardcoded values?
So don’t worry. Here we are to make your time productive and simplifying the process.