MongoDB Setup on Kubernetes using MongoDB Operator

MongoDB is a popular NoSQL database that supports large as well as small size of datasets. Just like any other database standalone setup, MongoDB is straightforward but we have to make a replicated or shared cluster of MongoDB, and there we have certain complications. Especially if we are doing these kinds of setups in orchestration tools like Kubernetes.

There is a lot of complexity in setting up MongoDB on Kubernetes that people(including me) have faced for a long time which I would like to highlight:-

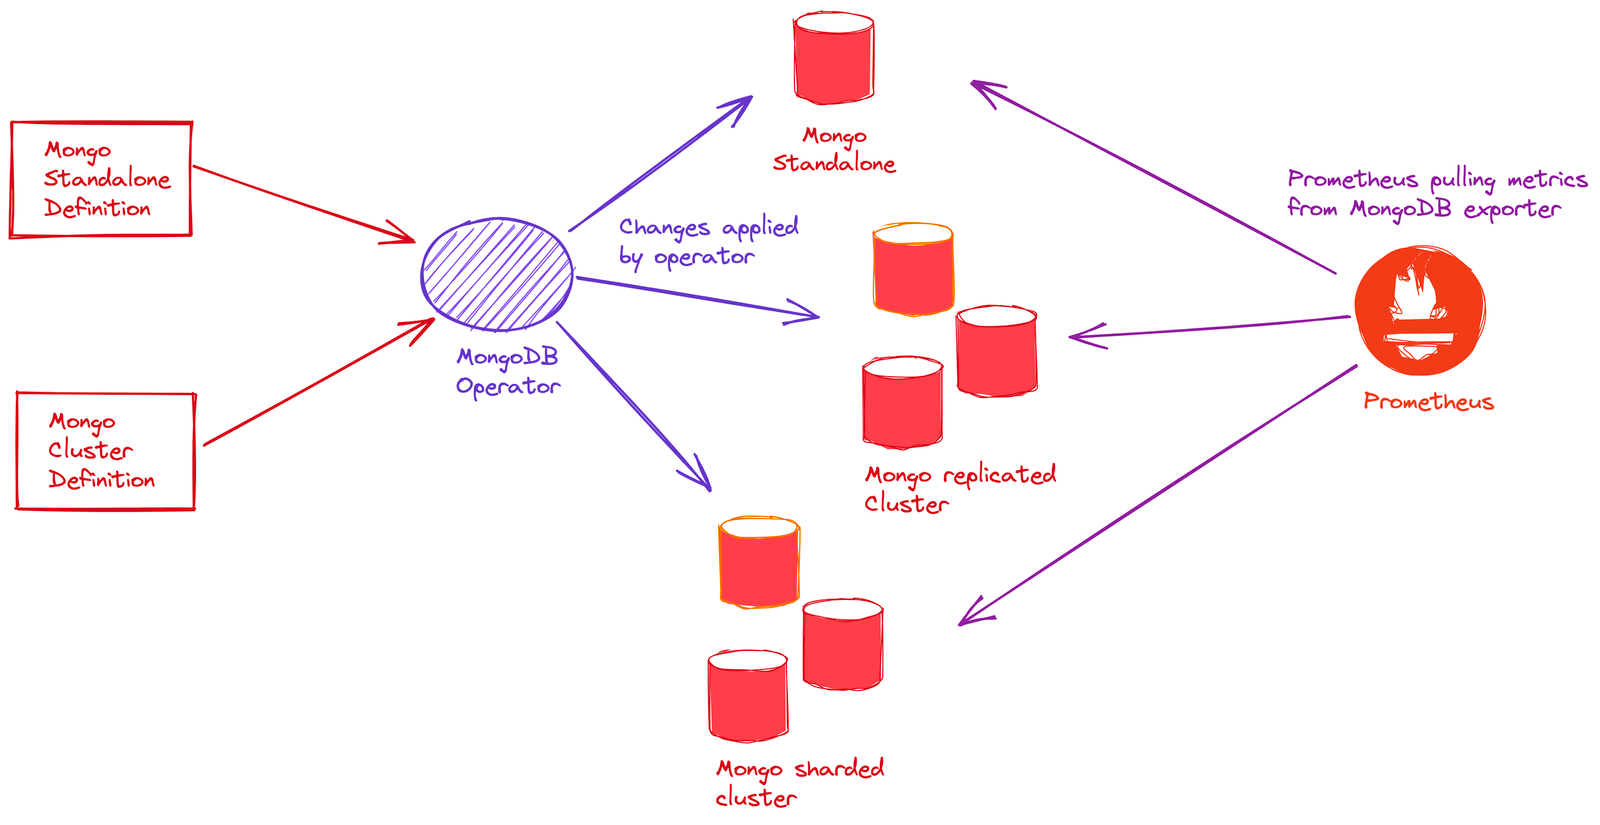
  • Standalone setup is pretty straightforward but for replicated and sharded clusters additional mongo configurations are required.
  • In the replicated scenario, separate configurations need to be managed for the leader and follower.
  • Monitoring and access management of MongoDB inside Kubernetes is a little tricky part to handle.
Continue reading “MongoDB Setup on Kubernetes using MongoDB Operator”

Alerting Through Azure Logic Apps

As we know alerting is the most crucial part of any infrastructure, and it becomes even more challenging when our infrastructure grows since we cannot monitor everything every time. Every client wants to get notified by their own alerting system before their customer reaches out to them and informs “Hey this service is not working or I am not able to access XYZ service“.

Alerting helps to ensure that the system remains healthy, responsive, and secure. It’s an important part of any system that makes performance, availability, and efficiency high. An operator might need to be notified of the event that triggers the alert.

We can set up alerts in many ways, but in this blog, I will be focussing on setting up alerting through azure logic apps.

Azure provides multiple options to send an alert to the end user, maybe through email, Slack, Pagerduty, SMS, etc. In this blog, I will be explaining the way to send an alert through email, Slack, and Pagerduty.

Continue reading “Alerting Through Azure Logic Apps”

Observability for Monitoring Microservices — Top 5 Ways!

Introduction

Knowing what’s running inside the container, how the application and code are performing is critical for tackling important issues. Discussed here are some important Microservices monitoring tools and approaches. Take a look!

With Microservices architecture becoming the de facto standard for web applications now, effective debugging and anomaly detection calls for a system that is observable — which means, the internal state of an application can be inferred by observing and tracking the metrics, traces and logs. Continue reading “Observability for Monitoring Microservices — Top 5 Ways!”

Complete Guide to Nginx Monitoring with Telegraf, Prometheus, and Grafana

Nginx is one of the most popular and widely used web servers mostly because of its speed and reliability. Nevertheless, it is paramount to keep track of the performance and availability that would help you to proactively prepare yourself for the worst scenarios like sudden/unexpected hikes in traffic. It will also keep you updated about the current state and health of your application.

This article will guide you on how to get Nginx Web Server metrics and visualize them. The main goal is a quick deployment and configuration using well-known open-source projects like Grafana, Prometheus, and Telegraf. Continue reading “Complete Guide to Nginx Monitoring with Telegraf, Prometheus, and Grafana”

Introduction to Prometheus Monitoring

Our Team hosted a Workshop on Prometheus which was very insightful and made absolute sense in terms of the Principles and the application part. The audience strength was pretty amazing, besides this, we also received many queries from the people who couldn’t join because of the Virtual Meet Limit. So, we shared the recording and the slides on social platforms. Here we try to share a glimpse of the workshop while keeping the same essence.

Continue reading “Introduction to Prometheus Monitoring”