Why APM is Extremely Significant!

We all have faced the problem when the system gets too slow. Have you wondered why this problem occurs? Well, there could be several reasons but one of them is application performance. In today’s time, the term application has become very large and complex. Users using these applications often choose different mediums, as they have separate goals and requirements as per their needs.

This diversity in consumption medium brings complexity in a configuration which is only increasing in today’s time. Application performance means how available your application is for this real-world which brings us to APM. In this blog, first of all, we will discuss, what is APM, why it is needed, and what are the APM tools, which can help us obtain the information and health of the system.

Continue reading “Why APM is Extremely Significant!”

Make Your Own Rules, ElastAlert Style


Right off the bat, I want to say that, this blog does not cover installing and configuring ElastAlert in the usual sense, i.e. working with pre-existing rules. It helps, I hope, in understanding the requirements for adding one’s own rule. Continue reading “Make Your Own Rules, ElastAlert Style”

Kafka Manager On Kubernetes


                                kafka-manager-on-kubernetes


We likely know Kafka as a durable, scalable and fault-tolerant publish-subscribe messaging system. Recently I got a requirement to efficiently monitor and manage our Kafka cluster, and I started looking for different solutions. Kafka-manager is an open source tool introduced by Yahoo to manage and monitor the Apache Kafka cluster via UI.

Before I share my experience of configuring Kafka manager on Kubernetes, let’s go through its considerable features
 

As per their documentation on github below are the major features: 

Clusters:
 
  • Manage multiple clusters.
  • Easy inspection of the cluster state.

Brokers:

  • Run preferred replica election.
  • Generate partition assignments with the option to select brokers to use
  • Run reassignment of a partition (based on generated assignments)

Topics:

  • Create a topic with optional topic configs (0.8.1.1 has different configs than 0.8.2+)
  • Delete topic (only supported on 0.8.2+ and remember set delete.topic.enable=true in broker config)
  • The topic list now indicates topics marked for deletion (only supported on 0.8.2+)
  • Batch generate partition assignments for multiple topics with the option to select brokers to use
  • Batch run reassignment of partition for multiple topics
  • Add partitions to an existing topic
  • Update config for an existing topic

Metrics:

  • Optionally filter out consumers that do not have ids/ owners/ & offsets/ directories in zookeeper.
  • Optionally enable JMX polling for broker level and topic level metrics.

Prerequisites of Kafka Manager:

We should have a running Apache Kafka with Apache Zookeeper.

 
  • Apache Zookeeper
  • Apache Kafka

Deployment on Kubernetes: 

To deploy Kafka Manager on Kubernetes, we need to create deployment and service file as given below.
 
You can find these sample file at https://github.com/vishant07/kafka-manager

After deployment, we should able to access Kafka manager service via http://:8080

We have two files to Kafka-manager-service.yaml and kafka-manager.yaml to achieve above-mentioned setup. Let’s have a brief description of the different attributes used in these files. 

Deployment configuration file: 


namespace: provide a namespace to isolate application within Kubernetes.

replicas: number of containers to spun up.
image: provide the path of docker image to be used.
containerPorts: on which port you want to run your application.
environment: “ZK_HOSTS” provide the address of already running zookeeper.

Service configuration file:

This file contains the details to create Kafka manager service ok Kubernetes. For demo purpose, I have used the node port method to expose my service. 

As we are using Kubernetes for our underlying platform of deployment it is recommended not to use external IP to access any service. Either we should go with LoadBalancer or use ingress (recommended method) rather than exposing all microservices.  


To configure ingress, please take a note from Kubernetes Ingress.


Once we are able to access Kafka manager we can see similar screens. 
 

Cluster Management

Topic List


Major Issues

 
To get broker level and topic level metrics we have to enable JMX polling.
 
So what we will generally do is to set the environment variable in the kubernetes manifest but somehow it is not working most of the times.


To resolve this you need to update JMX settings while creating your docker image as given as below.

vim /opt/kafka/bin/kafka-run-class.sh


if [ -z "$KAFKA_JMX_OPTS" ]; then
#KAFKA_JMX_OPTS="-Dcom.sun.management.jmxremote -Dcom.sun.management.jmxremote.authenticate=false  -Dcom.sun.management.jmxremote.ssl=false "

KAFKA_JMX_OPTS="-Dcom.sun.management.jmxremote=true -Dcom.sun.management.jmxremote.authenticate=false -Dcom.sun.management.jmxremote.ssl=false -Djava.rmi.server.hostname=$HOSTNAME -Djava.net.preferIPv4Stack=true"

fi
 

Conclusion

 
Deploying Kafka manager on Kubernetes encourages the easy setup, provides efficient manageability and all-time availability. Managing Kafka cluster over CLI becomes a tedious task and here Kafka manager helps to focus more on the use of Kafka rather than investing our time to configure and manage it.  It becomes useful at Enterprise Level, where system engineers can manage multiple Kafka clusters easily via UI.
Reference links:
Image: google image search
Documentation: https://github.com/yahoo/kafka-manager


AlertManager Integration with Prometheus

One day I got a call from one of my friend and he said to me that he is facing difficulties while setting up AlertManager with Prometheus. Then, I observed that most of the people face such issues while establishing a connection between AlertManager and receiver such as E-mail, Slack etc.

From there, I got motivation for writing this blog so AlertManager setup with Prometheus will be a piece of cake for everyone.

If you are new to AlertManager I would suggest you go through with our Prometheus blog.

What Actually AlertManager Is?

AlertManager is used to handle alerts for client applications (like Prometheus). It also takes care of alerts deduplicating, grouping and then routes them to different receivers such as E-mail, Slack, Pager Duty.

In this blog, we will only discuss on Slack and E-mail receivers.

AlertManager can be configured via command-line flags and configuration file. While command line flags configure system parameters for AlertManager,  the configuration file defines inhibition rules, notification routing, and notification receivers.

Architecture

Here is a basic architecture of AlertManager with Prometheus.

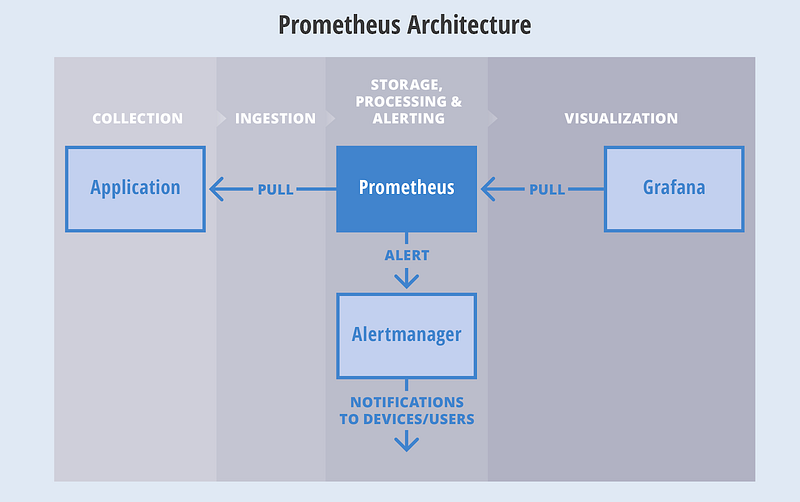
This is how Prometheus architecture works:-

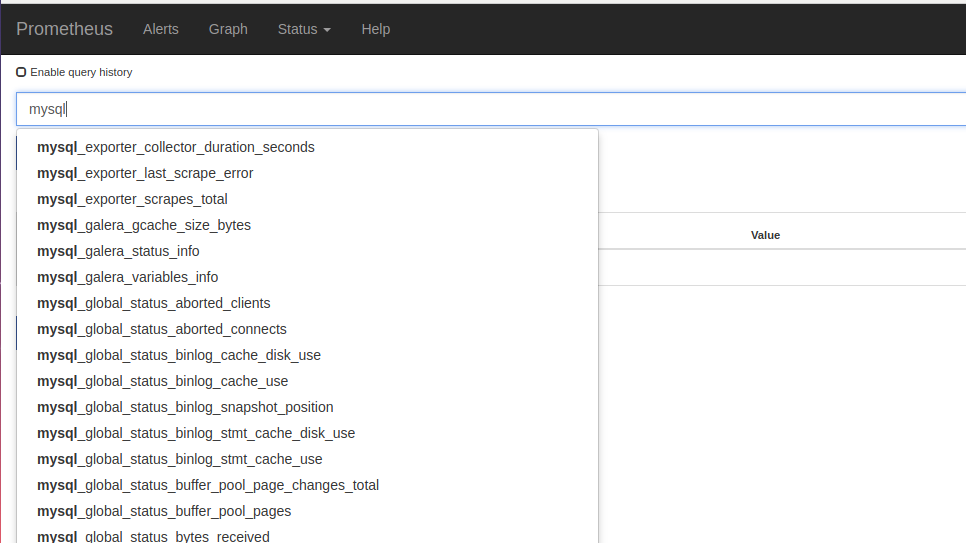
  • If you see in the above picture Prometheus is scraping the metrics from its client application(exporters).
  • When the alert is generated then it pushes it to the AlertManager, later AlertManager validates the alerts groups on the basis of labels.
  • and then forward it to the receivers like Email or Slack.

If you want to use a single AlertManager for multiple Prometheus server you can also do that. Then architecture will look like this:-

Installation

Installation part of AlertManager is not a fancy thing, we just simply need to download the latest binary of AlertManager from here.

$ cd /opt/
$ wget https://github.com/prometheus/alertmanager/releases/download/v0.11.0/alertmanager-0.11.0.linux-amd64.tar.gz

After downloading, let’s extract the files.

$ tar -xvzf alertmanager-0.11.0.linux-amd64.tar.gz

So we can start AlertManager from here as well but it is always a good practice to follow Linux directory structure.

$ mv alertmanager-0.11.0.linux-amd64/alertmanager /usr/local/bin/

 Configuration

Once the tar file is extracted and binary file is placed at the right location then the configuration part will come. Although AlertManager extracted directory contains the configuration file as well but it is not of our use. So we will create our own configuration. Let’s start by creating a directory for configuration.

$ mkdir /etc/alertmanager/

Then the configuration file will take place.

$ vim /etc/alertmanager/alertmanager.yml

The configuration file for Slack will look like this:-

global:


# The directory from which notification templates are read.
templates:
- '/etc/alertmanager/template/*.tmpl'

# The root route on which each incoming alert enters.
route:
  # The labels by which incoming alerts are grouped together. For example,
  # multiple alerts coming in for cluster=A and alertname=LatencyHigh would
  # be batched into a single group.
  group_by: ['alertname', 'cluster', 'service']

  # When a new group of alerts is created by an incoming alert, wait at
  # least 'group_wait' to send the initial notification.
  # This way ensures that you get multiple alerts for the same group that start
  # firing shortly after another are batched together on the first
  # notification.
  group_wait: 3s

  # When the first notification was sent, wait 'group_interval' to send a batch
  # of new alerts that started firing for that group.
  group_interval: 5s

  # If an alert has successfully been sent, wait 'repeat_interval' to
  # resend them.
  repeat_interval: 1m

  # A default receiver
  receiver: mail-receiver

  # All the above attributes are inherited by all child routes and can
  # overwritten on each.

  # The child route trees.
  routes:
  - match:
      service: node
    receiver: mail-receiver

    routes:
    - match:
        severity: critical
      receiver: critical-mail-receiver

  # This route handles all alerts coming from a database service. If there's
  # no team to handle it, it defaults to the DB team.
  - match:
      service: database
    receiver: mail-receiver
    routes:
    - match:
        severity: critical
      receiver: critical-mail-receiver

receivers:
- name: 'mail-receiver'
  slack_configs:
  - api_url:  https://hooks.slack.com/services/T2AGPFQ9X/B94D2LHHD/jskljaganauheajao2
    channel: '#prom-alert'

   - name: 'critical-mail-receiver'
  slack_configs: 
  
  - api_url:   https://hooks.slack.com/services/T2AGPFQ9X/B94D2LHHD/abhajkaKajKaALALOPaaaJk  channel: '#prom-alert'

You just have to replace the channel name and api_url of the Slack with your information.

The configuration file for E-mail will look something like this:-

global:

templates:
- '/etc/alertmanager/*.tmpl'
# The root route on which each incoming alert enters.
route:
  # default route if none match
  receiver: alert-emailer

  # The labels by which incoming alerts are grouped together. For example,
  # multiple alerts coming in for cluster=A and alertname=LatencyHigh would
  # be batched into a single group.
  # TODO:
  group_by: ['alertname', 'priority']

  # All the above attributes are inherited by all child routes and can
  # overwritten on each.

receivers:
- name: alert-emailer
  email_configs:
  - to: 'receiver@example.com'
    send_resolved: false
    from: 'sender@example.com'
    smarthost: 'smtp.example.com:587'
    auth_username: 'sender@example.com'
    auth_password: 'IamPassword'
    auth_secret: 'sender@example.com'
    auth_identity: 'sender@example.com'

In this configuration file, you need to update the sender and receiver mail details and the authorization password of the sender.

Once the configuration part is done we just have to create a storage directory where AlertManger will store its data.

$ mkdir /var/lib/alertmanager

Then only last piece which will be remaining is my favorite part i.e creating service 🙂

$ vi /etc/systemd/system/alertmanager.service

The service file will look like this:-

[Unit]
Description=AlertManager Server Service
Wants=network-online.target
After=network-online.target

[Service]
User=root
Group=root
Type=Simple
ExecStart=/usr/local/bin/alertmanager \
    --config.file /etc/alertmanager/alertmanager.yml \
    --storage.tsdb.path /var/lib/alertmanager

[Install]
WantedBy=multi-user.target

Then reload the daemon and start the service

$ systemctl daemon-reload
$ systemctl start alertmanager
$ systemctl enable alertmanager

Now you are all set to fire up your monitoring and alerting. So just take a beer and relax until Alert Manager notifies you for alerts. All the best!!!!

Setting up MySQL Monitoring with Prometheus

One thing that I love about Prometheus is that it has a multitude of Integration with different services, both officially supported and the third party supported.
Let’s see how can we monitor MySQL with Prometheus.Those who are the starter or new to Prometheus can refer to our this blog.MySQL is a popular opensource relational database system, which exposed a large number of metrics for monitoring but not in Prometheus format. For capturing that data in Prometheus format we use mysqld_exporter.

I am assuming that you have already setup MySQL Server.

Configuration changes in MySQL

For setting up MySQL monitoring, we need a user with reading access on all databases which we can achieve by an existing user also but the good practice is that we should always create a new user in the database for new service.
CREATE USER 'mysqld_exporter'@'localhost' IDENTIFIED BY 'password' WITH MAX_USER_CONNECTIONS 3;
After creating a user we simply have to provide permission to that user.
GRANT PROCESS, REPLICATION CLIENT, SELECT ON *.* TO 'mysqld_exporter'@'localhost';

Setting up MySQL Exporter

Download the mysqld_exporter from GitHub. We are downloading the 0.11.0 version as per latest release now, change the version in future if you want to download the latest version.
 
wget https://github.com/prometheus/mysqld_exporter/releases/download/v0.11.0/mysqld_exporter-0.11.0.linux-amd64.tar.gz
 
Then simply extract the tar file and move the binary file at the appropriate location.
tar -xvf mysqld_exporter-0.11.0.linux-amd64.tar.gz
mv mysqld_exporter /usr/bin/

Although we can execute the binary simply, but the best practice is to create service for every Third Party binary application. Also, we are assuming that systemd is already installed in your system. If you are using init then you have to create init service for the exporter.

useradd mysqld_exporter
vim /etc/systemd/system/mysqld_exporter.service
[Unit]
Description=MySQL Exporter Service
Wants=network.target
After=network.target

[Service]
User=mysqld_exporter
Group=mysqld_exporter
Environment="DATA_SOURCE_NAME=mysqld_exporter:password@unix(/var/run/mysqd/mysqld.sock)"
Type=simple
ExecStart=/usr/bin/mysqld_exporter
Restart=always

[Install]
WantedBy=multi-user.target
You may need to adjust the socket location of Unix according to your environment
If you go and visit the http://localhost.com:9104/metrics, you will be able to see them.

Prometheus Configurations

For scrapping metrics from mysqld_exporter in Prometheus we have to make some configuration changes in Prometheus, the changes are not fancy, we just have to add another job for mysqld_exporter, like this:-
vim /etc/prometheus/prometheus.yml
  - job_name: 'mysqld_exporter'
    static_configs:
      - targets:
          - :9104

After the configuration changes, we just have to restart the Prometheus server.

systemctl restart prometheus

Then, if you go to the Prometheus server you can find the MySQL metrics there like this:-

So In this blog, we have covered MySQL configuration changes for Prometheus, mysqld_exporter setup and Prometheus configuration changes.
In the next part, we will discuss how to create a visually impressive dashboard in Grafana for better visualization of MySQL metrics. See you soon… 🙂