Redis Best Practices and Performance Tuning for High-Speed Systems

In modern high traffic systems, Redis is one of the fastest in-memory data stores, but without proper tuning, even Redis can start showing performance bottlenecks.

The solution? Performance tuning and configuration optimization.

This guide covers the most important Redis performance tuning practices every DevOps engineer, SRE, or backend developer must follow.

One of the thing that I love about my organization is that you don’t have to do the same repetitive work, you will always get the chance to explore some new technologies. The same chance came across to me a few days back when one of our clients was facing issue with Redis.
They were using the Redis Cluster with Sentinel for which they were facing issue regarding performance, whenever the connection request was high the Redis Cluster was not able to bear the load.
Since they were using a decent configuration of the server in terms of CPU and Memory but the result was the same. So now what????
The Answer was to tune the performance. Continue reading “Redis Best Practices and Performance Tuning for High-Speed Systems”

Best Practices for Writing a Shell Script

I am a lazy DevOps Engineer. So whenever I came across the same task more than 2 times I automate that. Although now we have many automation tools, still the first thing that hit into our mind for automation is bash or shell script.
After making a lot of mistakes and messy scripts :), I am sharing my experiences for writing a good shell script which not only looks good but also it will reduce the chances of error.

The things that every code should have:-
     – A minimum effort in the modification.
     – Your program should talk in itself, so you don’t have to explain it.
     – Reusability, Of course, I can’t write the same kind of script or program again and again.

I am a firm believer in learning by doing. So let’s create a problem statement for ourselves and then try to solve it via shell scripting with best practices :). I would like to have solutions in the comment section of this blog.


Problem Statement:- Write a shell script to install and uninstall a package(vim) depending on the arguments. The script should tell if the package is already installed. If no argument is passed it should print the help page.

So without wasting time let’s start for writing an awesome shell script. Here is the list of things that should always be taken care of while writing a shell script.

Lifespan of Script

If your script is procedural(each subsequent steps relies on the previous step to complete), do me a favor and add set -e in starting of the script so that the script exists on the first error. For example:-

#!/bin/bash
set -e # Script exists on the first failure
set -x # For debugging purpose

Functions

Ahha, Functions are my most favorite part of programming. There is a saying

Any fool can write code that a computer can understand. Good programmers write code that humans can understand. 

To achieve this always try to use functions and name them properly so that anyone can understand the function just by reading its name. Functions also provide the concept of re-usability. It also removes the duplicating of code, how? let’s see this

#!/bin/bash 
install_package() {
   local PACKAGE_NAME="$1"
   yum install "${PACKAGE_NAME}" -y
}
install_package "vim"

Command Sanity

Usually, scripts call other scripts or binary. When we are dealing with commands there are chances that commands will not be available on all systems. So my suggestion is to check them before proceeding.

#!/bin/bash  
check_package() {
    local PACKAGE_NAME="$1"
    if ! command -v "${PACKAGE_NAME}" > /dev/null 2>&1
    then
           printf "${PACKAGE_NAME} is not installed.\n"
    else
           printf "${PACKAGE_NAME} is already installed.\n"
    fi
}
check_package "vim"

Help Page

If you guys are familiar with Linux, you have certainly noticed that every Linux command has its help page. The same thing can be true for the script as well. It would be really helpful to include –help flag.

#!/bin/bash  
INITIAL_PARAMS="$*"
help_function() {
   {
        printf "Usage:- ./script <option>\n"
        printf "Options:\n"
        printf " -a ==> Install all base softwares\n"
        printf " -r ==> Remove base softwares\n"
    }
}
arg_checker() {
     if [ "${INITIAL_PARAMS}" == "--help" ]; then
            help_function
     fi
}
arg_checker

Logging

Logging is the most critical thing for everyone whether he is a developer, sysadmin or DevOps. Debugging seems to be impossible without logs. As we know most applications generate logs for understanding that what is happening with the application, the same practice can be implemented for shell script as well. For generating logs we have a bash utility called logger.

#!/bin/bash 
DATE=$(date)
declare DATE
check_file() {
     local FILENAME="$1"
     if ! ls "${FILENAME}" > /dev/null 2>&1
     then
            logger -s "${DATE}: ${FILENAME} doesn't exists"
     else
           logger -s "${DATE}: ${FILENAME} found successfuly"
     fi
}
check_file "/etc/passwd"

Variables

I like to name my variables in Capital letters with an underscore, In this way, I will not get confused with the function name and variable name. Never give a,b,c etc. as a variable name instead of that try to give a proper name to a variable as well just like functions.

#!/bin/bash 
# Use declare for declaring global variables
declare GLOBAL_MESSAGE="Hey, I am a global message"
# Use local for declaring local variables inside the function
message_print() {
    local LOCAL_MESSAGE="Hey, I am a local message"
    printf "Global Message:- ${GLOBAL_MESSAGE}\n"
    printf "Local Message:- ${LOCAL_MESSAGE}\n"
}
message_print

Cases

Cases are also a fascinating part of shell script. But the question is when to use this? According to me if your shell program is providing more than one functionality basis on the arguments then you should go for cases. For example:- If your shell utility provides the capability of installing and uninstalling the software.

#!/bin/bash  
print_message() {
    MESSAGE="$1"
    echo "${MESSAGE}"
}
case "$1" in
   -i|--input)
      print_message "Input Message"
      ;;
   -o|--output)
        print_message "Output Message"
        ;;
   --debug)
       print_message "Debug Message"
       ;;
    *)
      print_message "Wrong Input"
      ;;
esac

In this blog, we have covered functions, variables, the lifespan of a script, logging, help page, command sanity. I hope these topics help you in your daily life while using the shell script. If you have any feedback please let me know through comments.
Cheers Till the next Time!!!!

AlertManager Integration with Prometheus

One day I got a call from one of my friend and he said to me that he is facing difficulties while setting up AlertManager with Prometheus. Then, I observed that most of the people face such issues while establishing a connection between AlertManager and receiver such as E-mail, Slack etc.

From there, I got motivation for writing this blog so AlertManager setup with Prometheus will be a piece of cake for everyone.

If you are new to AlertManager I would suggest you go through with our Prometheus blog.

What Actually AlertManager Is?

AlertManager is used to handle alerts for client applications (like Prometheus). It also takes care of alerts deduplicating, grouping and then routes them to different receivers such as E-mail, Slack, Pager Duty.

In this blog, we will only discuss on Slack and E-mail receivers.

AlertManager can be configured via command-line flags and configuration file. While command line flags configure system parameters for AlertManager,  the configuration file defines inhibition rules, notification routing, and notification receivers.

Architecture

Here is a basic architecture of AlertManager with Prometheus.

This is how Prometheus architecture works:-

  • If you see in the above picture Prometheus is scraping the metrics from its client application(exporters).
  • When the alert is generated then it pushes it to the AlertManager, later AlertManager validates the alerts groups on the basis of labels.
  • and then forward it to the receivers like Email or Slack.

If you want to use a single AlertManager for multiple Prometheus server you can also do that. Then architecture will look like this:-

Installation

Installation part of AlertManager is not a fancy thing, we just simply need to download the latest binary of AlertManager from here.

$ cd /opt/
$ wget https://github.com/prometheus/alertmanager/releases/download/v0.11.0/alertmanager-0.11.0.linux-amd64.tar.gz

After downloading, let’s extract the files.

$ tar -xvzf alertmanager-0.11.0.linux-amd64.tar.gz

So we can start AlertManager from here as well but it is always a good practice to follow Linux directory structure.

$ mv alertmanager-0.11.0.linux-amd64/alertmanager /usr/local/bin/

 Configuration

Once the tar file is extracted and binary file is placed at the right location then the configuration part will come. Although AlertManager extracted directory contains the configuration file as well but it is not of our use. So we will create our own configuration. Let’s start by creating a directory for configuration.

$ mkdir /etc/alertmanager/

Then the configuration file will take place.

$ vim /etc/alertmanager/alertmanager.yml

The configuration file for Slack will look like this:-

global:


# The directory from which notification templates are read.
templates:
- '/etc/alertmanager/template/*.tmpl'

# The root route on which each incoming alert enters.
route:
  # The labels by which incoming alerts are grouped together. For example,
  # multiple alerts coming in for cluster=A and alertname=LatencyHigh would
  # be batched into a single group.
  group_by: ['alertname', 'cluster', 'service']

  # When a new group of alerts is created by an incoming alert, wait at
  # least 'group_wait' to send the initial notification.
  # This way ensures that you get multiple alerts for the same group that start
  # firing shortly after another are batched together on the first
  # notification.
  group_wait: 3s

  # When the first notification was sent, wait 'group_interval' to send a batch
  # of new alerts that started firing for that group.
  group_interval: 5s

  # If an alert has successfully been sent, wait 'repeat_interval' to
  # resend them.
  repeat_interval: 1m

  # A default receiver
  receiver: mail-receiver

  # All the above attributes are inherited by all child routes and can
  # overwritten on each.

  # The child route trees.
  routes:
  - match:
      service: node
    receiver: mail-receiver

    routes:
    - match:
        severity: critical
      receiver: critical-mail-receiver

  # This route handles all alerts coming from a database service. If there's
  # no team to handle it, it defaults to the DB team.
  - match:
      service: database
    receiver: mail-receiver
    routes:
    - match:
        severity: critical
      receiver: critical-mail-receiver

receivers:
- name: 'mail-receiver'
  slack_configs:
  - api_url:  https://hooks.slack.com/services/T2AGPFQ9X/B94D2LHHD/jskljaganauheajao2
    channel: '#prom-alert'

   - name: 'critical-mail-receiver'
  slack_configs: 
  
  - api_url:   https://hooks.slack.com/services/T2AGPFQ9X/B94D2LHHD/abhajkaKajKaALALOPaaaJk  channel: '#prom-alert'

You just have to replace the channel name and api_url of the Slack with your information.

The configuration file for E-mail will look something like this:-

global:

templates:
- '/etc/alertmanager/*.tmpl'
# The root route on which each incoming alert enters.
route:
  # default route if none match
  receiver: alert-emailer

  # The labels by which incoming alerts are grouped together. For example,
  # multiple alerts coming in for cluster=A and alertname=LatencyHigh would
  # be batched into a single group.
  # TODO:
  group_by: ['alertname', 'priority']

  # All the above attributes are inherited by all child routes and can
  # overwritten on each.

receivers:
- name: alert-emailer
  email_configs:
  - to: 'receiver@example.com'
    send_resolved: false
    from: 'sender@example.com'
    smarthost: 'smtp.example.com:587'
    auth_username: 'sender@example.com'
    auth_password: 'IamPassword'
    auth_secret: 'sender@example.com'
    auth_identity: 'sender@example.com'

In this configuration file, you need to update the sender and receiver mail details and the authorization password of the sender.

Once the configuration part is done we just have to create a storage directory where AlertManger will store its data.

$ mkdir /var/lib/alertmanager

Then only last piece which will be remaining is my favorite part i.e creating service 🙂

$ vi /etc/systemd/system/alertmanager.service

The service file will look like this:-

[Unit]
Description=AlertManager Server Service
Wants=network-online.target
After=network-online.target

[Service]
User=root
Group=root
Type=Simple
ExecStart=/usr/local/bin/alertmanager \
    --config.file /etc/alertmanager/alertmanager.yml \
    --storage.tsdb.path /var/lib/alertmanager

[Install]
WantedBy=multi-user.target

Then reload the daemon and start the service

$ systemctl daemon-reload
$ systemctl start alertmanager
$ systemctl enable alertmanager

Now you are all set to fire up your monitoring and alerting. So just take a beer and relax until Alert Manager notifies you for alerts. All the best!!!!

Using Ansible Dynamic Inventory with Azure can save the day for you.

As a DevOps Engineer, I always love to make things simple and convenient by automating them. Automation can be done on many fronts like infrastructure, software, build and release etc.

Ansible is primarily a software configuration management tool which can also be used as an infrastructure provisioning tool.
One of the thing that I love about Ansible is its integration with different cloud providers. This integration makes things really loosely coupled, For ex:- we don’t require to manage whole information of cloud in Ansible (Like we don’t need instance metadata information for provisioning it).

Ansible Inventory

Ansible uses a term called inventory to refer to the set of systems or machines that our Ansible playbook or command work against. There are two ways to manage inventory:-
  • Static Inventory
  • Dynamic Inventory
By default, the static inventory is defined in /etc/ansible/hosts in which we provide information about the target system. In most of the cloud platform when the server gets reboot then it reassigns a new public address and again we have to update that in our static inventory, so this can’t be the lasting option.
Luckily Ansible supports the concept of dynamic inventory in which we have some python scripts and a .ini file through which we can provision machines dynamically without knowing its public or private address. Ansible Dynamic Inventory is fed by using external python scripts and .ini files provided by Ansible for cloud infrastructure platforms like Amazon, Azure, DigitalOcean, Rackspace.
In this blog, we will talk about how to configure dynamic inventory on the Azure Cloud Platform.

Ansible Dynamic Inventory on Azure

The first thing that always required to run anything is software and its dependencies. So let’s install the software and its dependencies first. First, we need the python modules of azure that we can install via pip.
 
$ pip install 'ansible[azure]'
After this, we need to download azure_rm.py

$ wget https://raw.githubusercontent.com/ansible/ansible/devel/contrib/inventory/azure_rm.py

Change the permission of file using chmod command.

$ chmod +x azure_rm.py

Then we have to log in to Azure account using azure-cli

$ az login
To sign in, use a web browser to open the page https://aka.ms/devicelogin and enter the code XXXXXXXXX to authenticate.

The az login command output will provide you a unique code which you have to enter in the webpage i.e.
https://aka.ms/devicelogin

As part of the best practice, we should always create an Active Directory for different services or apps to restrict privileges. Once you logged in Azure account you can create an Active Directory app for Ansible

$ az ad app create --password ThisIsTheAppPassword --display-name opstree-ansible --homepage ansible.opstree.com --identifier-uris ansible.opstree.com

Don’t forget to change your password ;). Note down the appID from the output of the above command.

Once the app is created, create a service principal to associate it with.

$ az ad sp create --id appID

Replace the appID with actual app id and copy the objectID from the output of the above command.
Now we just need the subscription id and tenant id, which we can get by a simple command

$ az account show

Note down the id and tenantID from the output of the above command.

Let’s assign a contributor role to service principal which is created above.

$ az role assignment create --assignee objectID --role contributor

Replace the objectID with the actual object id output.

All the azure side setup is done. Now we have to make some changes to your system.

Let’s start with creating an azure home directory

$ mkdir ~/.azure

In that directory, we have to create a credentials file

$ vim ~/.azure/credentials

[default]
subscription_id=id
client_id=appID
secret=ThisIsTheAppPassword
tenant=tenantID

Please replace the id, appID, password and tenantID with the above-noted things.

All set !!!! Now we can test it by below command

$ python ./azure_rm.py --list | jq

and the output should be like this:-

{
  "azure": [
    "ansibleMaster"
  ],
  "westeurope": [
    "ansibleMaster"
  ],
  "ansibleMasterNSG": [
    "ansibleMaster"
  ],
  "ansiblelab": [
    "ansibleMaster"
  ],
  "_meta": {
    "hostvars": {
      "ansibleMaster": {
        "powerstate": "running",
        "resource_group": "ansiblelab",
        "tags": {},
        "image": {
          "sku": "7.3",
          "publisher": "OpSTree",
          "version": "latest",
          "offer": "CentOS"
        },
        "public_ip_alloc_method": "Dynamic",
        "os_disk": {
          "operating_system_type": "Linux",
          "name": "osdisk_vD2UtEJhpV"
        },
        "provisioning_state": "Succeeded",
        "public_ip": "52.174.19.210",
        "public_ip_name": "masterPip",
        "private_ip": "192.168.1.4",
        "computer_name": "ansibleMaster",
        ...
      }
    }
  }
}

Now you are ready to use Ansible in Azure with dynamic inventory. Good Luck 🙂

Setting up MySQL Monitoring with Prometheus

One thing that I love about Prometheus is that it has a multitude of Integration with different services, both officially supported and the third party supported.
Let’s see how can we monitor MySQL with Prometheus.Those who are the starter or new to Prometheus can refer to our this blog.MySQL is a popular opensource relational database system, which exposed a large number of metrics for monitoring but not in Prometheus format. For capturing that data in Prometheus format we use mysqld_exporter.

I am assuming that you have already setup MySQL Server.

Configuration changes in MySQL

For setting up MySQL monitoring, we need a user with reading access on all databases which we can achieve by an existing user also but the good practice is that we should always create a new user in the database for new service.
CREATE USER 'mysqld_exporter'@'localhost' IDENTIFIED BY 'password' WITH MAX_USER_CONNECTIONS 3;
After creating a user we simply have to provide permission to that user.
GRANT PROCESS, REPLICATION CLIENT, SELECT ON *.* TO 'mysqld_exporter'@'localhost';

Setting up MySQL Exporter

Download the mysqld_exporter from GitHub. We are downloading the 0.11.0 version as per latest release now, change the version in future if you want to download the latest version.
 
wget https://github.com/prometheus/mysqld_exporter/releases/download/v0.11.0/mysqld_exporter-0.11.0.linux-amd64.tar.gz
 
Then simply extract the tar file and move the binary file at the appropriate location.
tar -xvf mysqld_exporter-0.11.0.linux-amd64.tar.gz
mv mysqld_exporter /usr/bin/

Although we can execute the binary simply, but the best practice is to create service for every Third Party binary application. Also, we are assuming that systemd is already installed in your system. If you are using init then you have to create init service for the exporter.

useradd mysqld_exporter
vim /etc/systemd/system/mysqld_exporter.service
[Unit]
Description=MySQL Exporter Service
Wants=network.target
After=network.target

[Service]
User=mysqld_exporter
Group=mysqld_exporter
Environment="DATA_SOURCE_NAME=mysqld_exporter:password@unix(/var/run/mysqd/mysqld.sock)"
Type=simple
ExecStart=/usr/bin/mysqld_exporter
Restart=always

[Install]
WantedBy=multi-user.target
You may need to adjust the socket location of Unix according to your environment
If you go and visit the http://localhost.com:9104/metrics, you will be able to see them.

Prometheus Configurations

For scrapping metrics from mysqld_exporter in Prometheus we have to make some configuration changes in Prometheus, the changes are not fancy, we just have to add another job for mysqld_exporter, like this:-
vim /etc/prometheus/prometheus.yml
  - job_name: 'mysqld_exporter'
    static_configs:
      - targets:
          - :9104

After the configuration changes, we just have to restart the Prometheus server.

systemctl restart prometheus

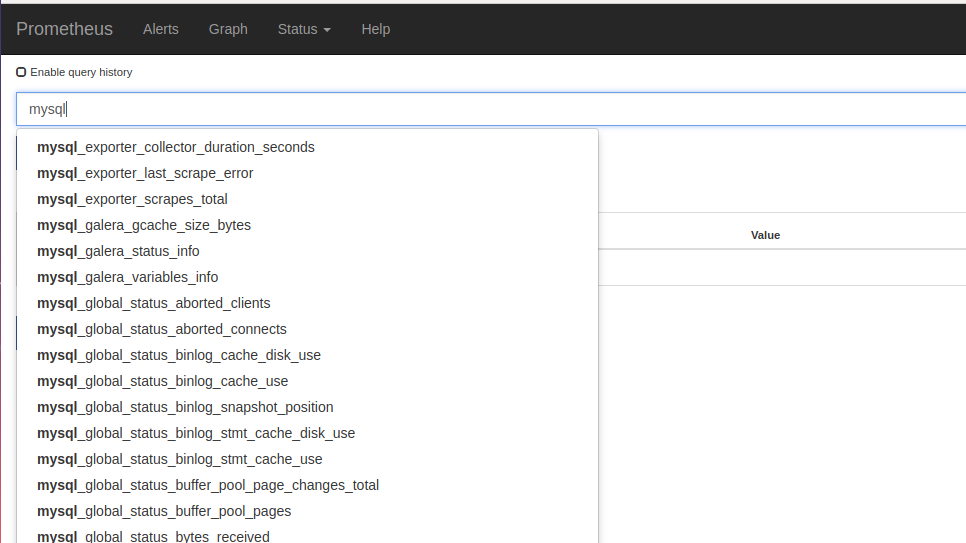
Then, if you go to the Prometheus server you can find the MySQL metrics there like this:-

So In this blog, we have covered MySQL configuration changes for Prometheus, mysqld_exporter setup and Prometheus configuration changes.
In the next part, we will discuss how to create a visually impressive dashboard in Grafana for better visualization of MySQL metrics. See you soon… 🙂