Data Migration Service
Have you ever thought about migrating your production database from one platform to another
and dropped this idea later, because it was too risky, you were not ready to
bare a downtime?
If yes, then please pay attention because this is what we are going to perform
in this article.
in this article.
A few days back we’re trying to migrate our production MySQL RDS from AWS to GCP, SQL, and we had to migrate data without downtime, accurate and
real-time and that too without the help of any Database Administrator.
real-time and that too without the help of any Database Administrator.
After doing a bit research and evaluating few services we finally started working on AWS DMS (Data Migration Service) and figured out this is a great service to migrate a
different kind of data.
different kind of data.
You can migrate your data to and from the most widely used commercial and open-source databases, and database platforms. Databases like Oracle, Microsoft SQL Server, and
PostgreSQL, MongoDB.
PostgreSQL, MongoDB.
The source database remains fully operational during the migration,
The service supports homogeneous migrations such as Oracle to Oracle,
and also heterogeneous migrations between different database platforms.
The service supports homogeneous migrations such as Oracle to Oracle,
and also heterogeneous migrations between different database platforms.
Let’s discuss some important features of AWS DMS:
- Migrates the database securely, quickly and accurately.
- No downtime required, works as schema converter as well.
- Supports various type or database like MySQL, MongoDB, PSQL etc.
- Migrates real-time data also synchronize ongoing changes.
- Data validation is available to verify database.
- Compatible with a long range of database platforms like RDS, Google SQL, on-premises etc.
- Inexpensive (Pricing is based on the compute resources used during the migration process).
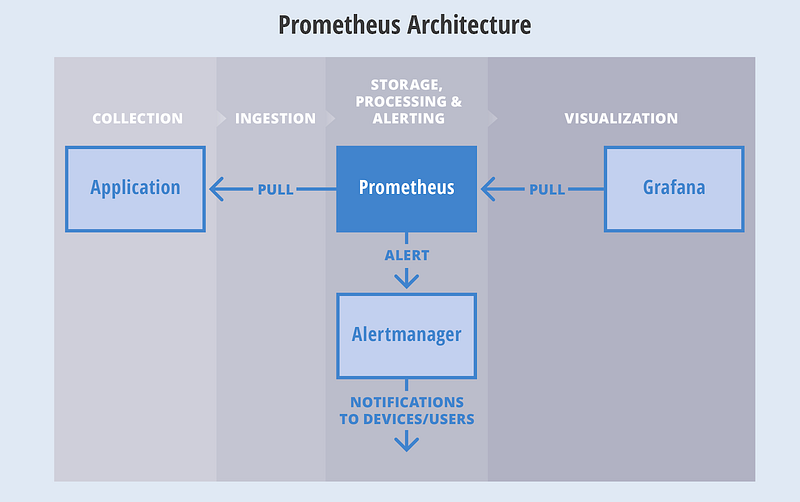
 |
| This is a typical migration scenario. |
Let’s perform step by step migration:
Note: We’ve performed migration from AWS RDS
to GCP SQL, you can choose database source and
destination as per your requirement.
- Create replication instance:
A replication instance initiates the connection between the source and target databases, transfers the data, cache any changes that occur on the source database during the initial data load.Use the fields to below to configure the parameters of your new replication instance including network and security information, encryption details, select instance class as per requirement.After completion, all mandatory fields click the next tab, and you will be redirected
to Replication Instance tab.Grab a coffee quickly while the instance is getting ready.
Hope you are ready with your coffee because the instance is ready now. - Now we are to create two endpoints “Source” and “Target” 2.1 Create Source Endpoint:
Click on “Run test” tab after completing all fields, make sure your Replication instance IP is whitelisted
under security group. 2.2 Create Target EndpointClick on “Run test” tab again after completing all fields, make sure your Replication instance IP is whitelisted under target DB authorization.Now we’ve ready Replication Instance, Source Endpoint, and Target Endpoint. - Finally, we’ll create a “Replication Task” to start replication.
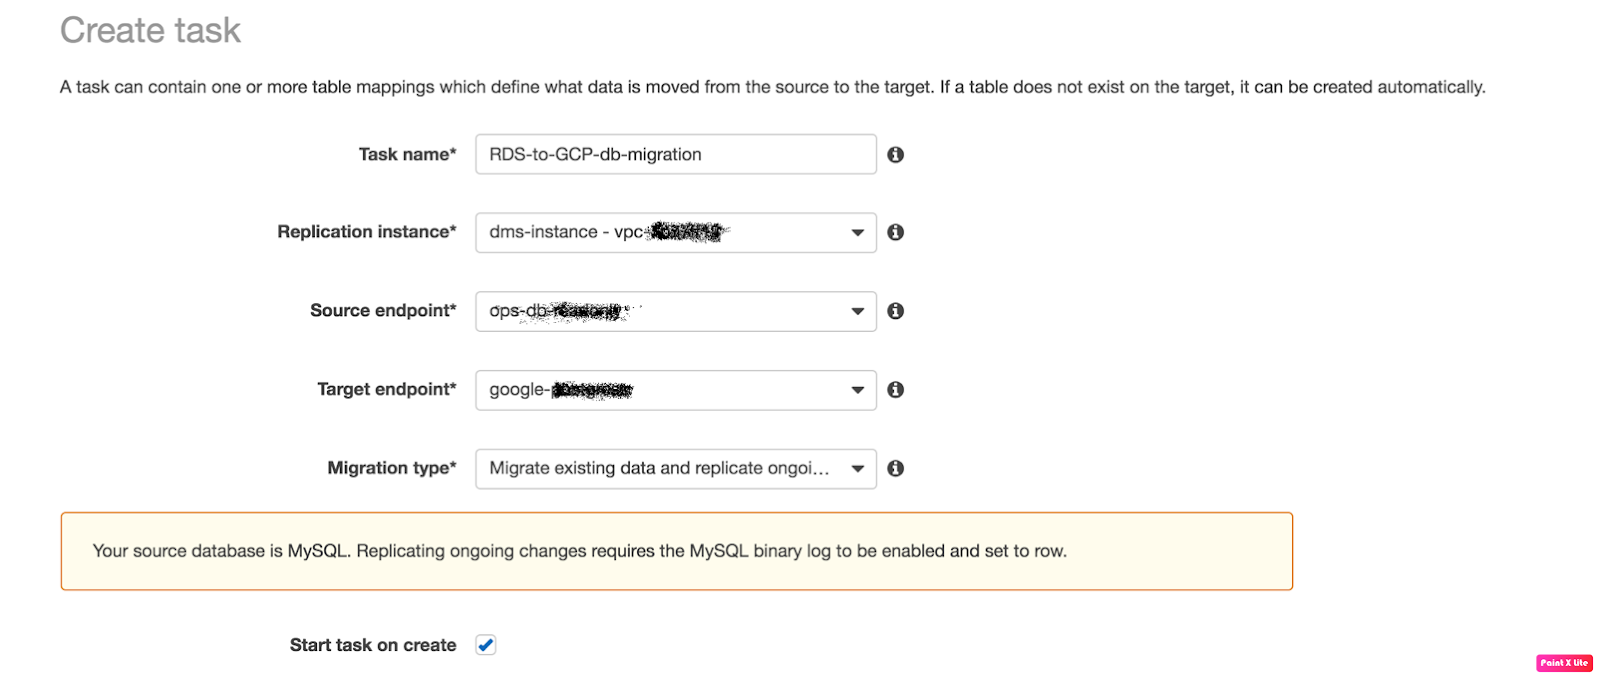
Fill the fields like:


- Task Name: any name
- Replication Instance: The instance we’ve created above
- Source Endpoint: The source database
- Target Endpoint: The target database
- Migration Type: Here I choose “Migration existing data and replication
ongoing” because we needed ongoing changes.
4. Verify the task status now.
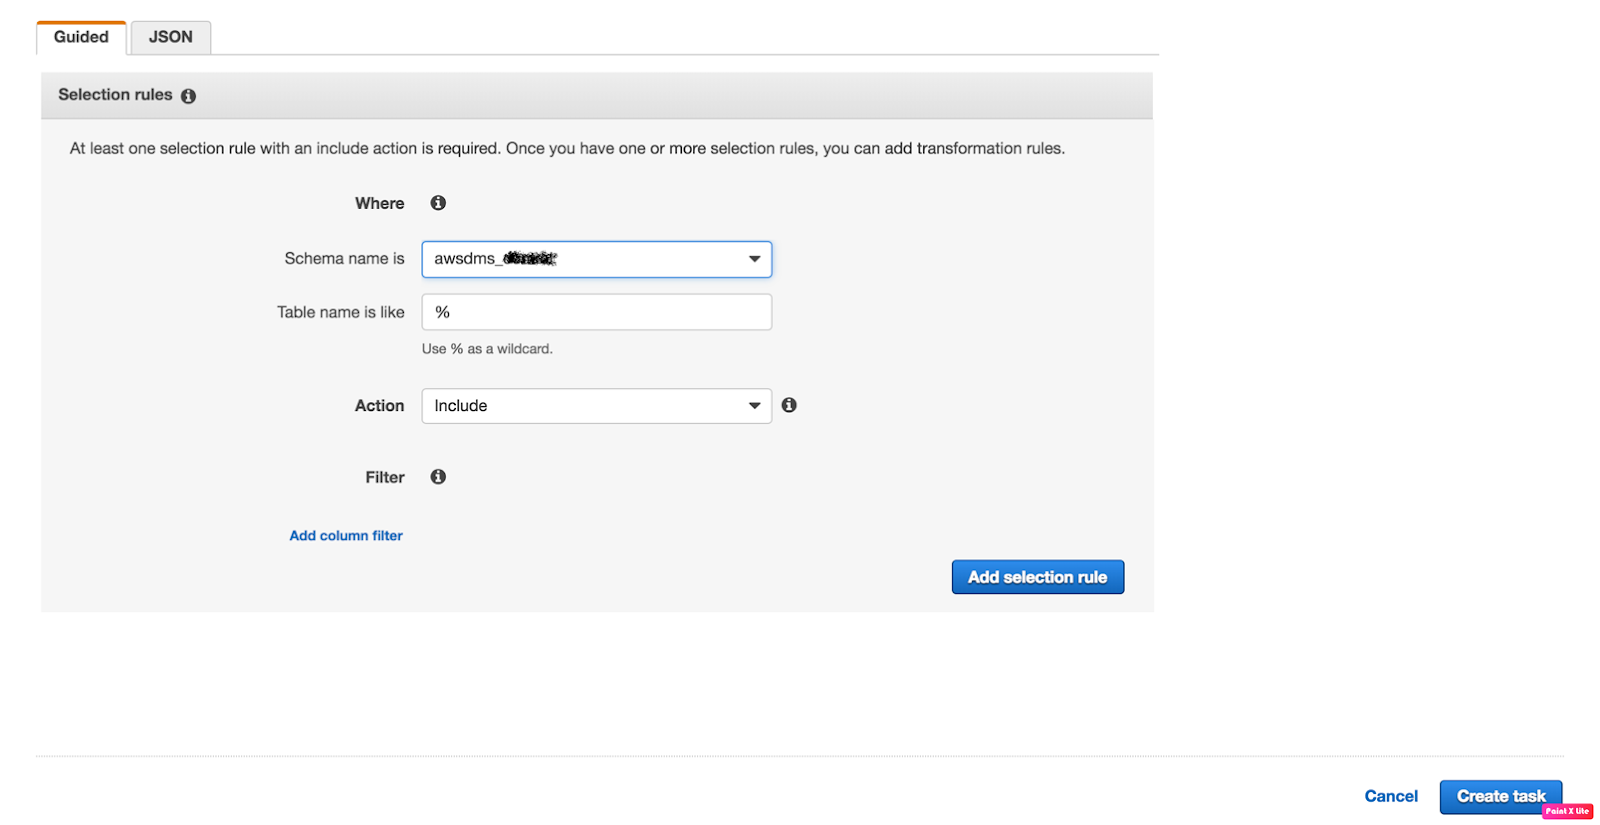
Once all the fields are completed click on the “Create task” and you will be
redirected to “Tasks” Tab.
redirected to “Tasks” Tab.
Check your task status
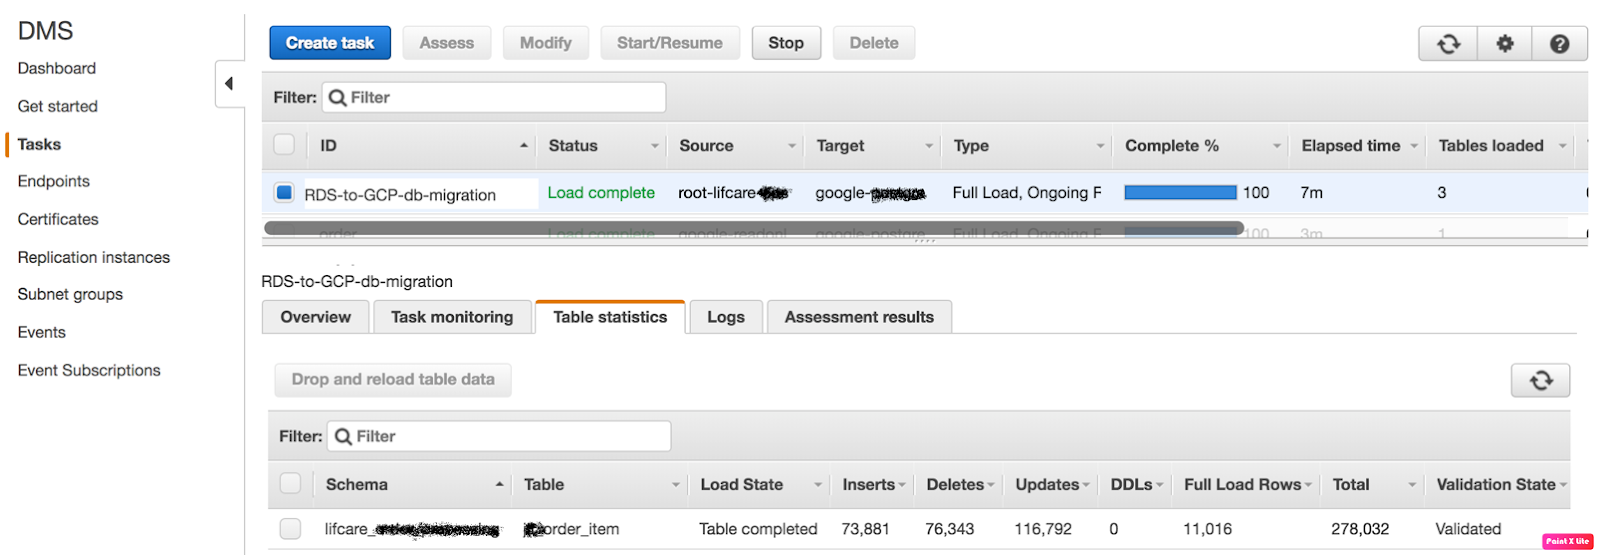
The task has been successfully completed now, you can verify the inserts tabs and validation tab,
The migration is done successfully if Validation State is “Validated” that means migration has been performed successfully.