Stay Away Replication Lag !

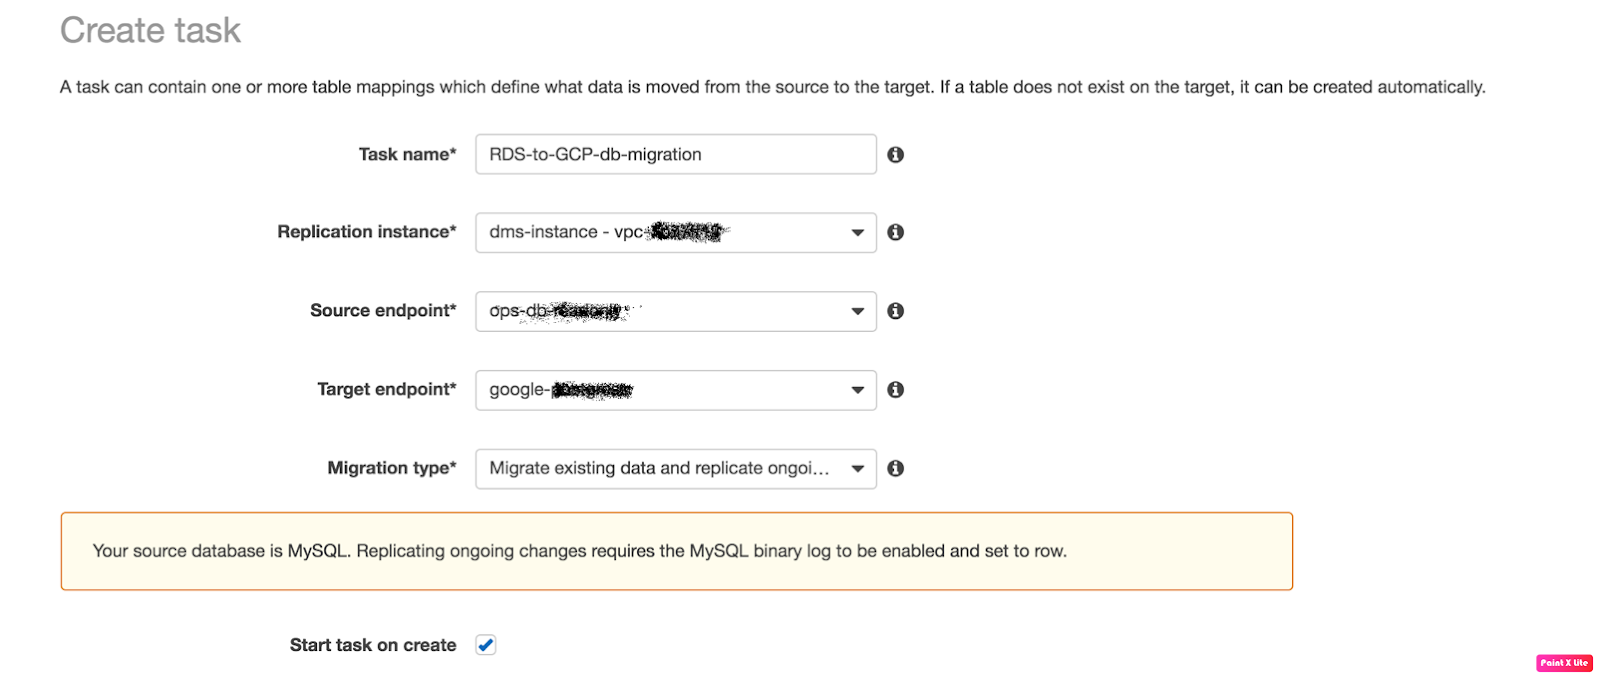
Recently, I got a requirement to facilitate backup for the data and a way to analyze it without using the main database. MySQL replication is a process that allows you to easily maintain multiple copies of MySQL data by having them copied automatically from a master to a slave database. 

Panic Starts

Everything was running smoothly in the night I configured it. But the joy didn’t last for long as the traffic hits in the morning, slave starts getting behind the master with few seconds which increases with the activity on the application. At the peak time, it was playing in thousands of second.

 What now, I had to dig deep into MySQL Replication

  • How it works 
  • What can probably cause the lag
  • An approach that minimizes or eliminates it

How MySQL Replication Works

On the master

First of all, master writes replication events to a special log called binary log. This is usually a very lightweight activity because writes are buffered and they are sequential. The binary log file stores data that replication slave will be reading later.

On the replica

When you start replication, two threads are started on the slave:
1. IO thread
This process connects to a master, reads binary log events from the master as they come in and just copies them over to a local log file called relay log.
Even though there’s only one thread reading the binary log from the master and one writing relay log on the slave, very rarely copying of replication events is a slower element of the replication. There could be a network delay, causing a steady delay of a few hundred milliseconds.
If you want to see where IO thread currently is, check the following in “show slave status \G”
Master_Log_File – last file copied from the master (most of the time it would be the same as last binary log written by a master)
Read_Master_Log_Pos – binary log from the master is copied over to the relay log on the slave up until this position.
And then you can compare it to the output of “show master status/G” from the master.

mysql> show master status\G;
*************************** 1. row ***************************
             File: db01-binary-log.000032
         Position: 1008761891
     Binlog_Do_DB: 
 Binlog_Ignore_DB: 
Executed_Gtid_Set: 
1 row in set (0.00 sec)

2. SQL thread
The second process – SQL thread – reads events from a relay log stored locally on the replication slave (the file that was written by IO thread) and then applies them as fast as possible.
Going back to “show slave status /G”, you can get the current status of SQL thread from the following variables:
Relay_Master_Log_File – binary log from the master, that SQL thread is “working on” (in reality it is working on relay log, so it’s just a convenient way to display information)
Exec_Master_Log_Pos – which position from the master binary log is being executed by SQL thread.

mysql> show slave status\G;
*************************** 1. row ***************************
               Slave_IO_State: Waiting for master to send event
                  Master_Host: <master_ip>
                  Master_User: <replication_user>
                  Master_Port: 3306
                Connect_Retry: 60
              Master_Log_File: db01-binary-log.000032
          Read_Master_Log_Pos: 1008768810
               Relay_Log_File: relay-bin.000093
                Relay_Log_Pos: 1008769035
        Relay_Master_Log_File: db01-binary-log.000032
             Slave_IO_Running: Yes
            Slave_SQL_Running: Yes
.
.
          Exec_Master_Log_Pos: 1008768810
              Relay_Log_Space: 1008769305
.
.
        Seconds_Behind_Master: 0
.
.
      Slave_SQL_Running_State: Slave has read all relay log; waiting for more updates
.
.
1 row in set (0.00 sec)

Why Replication Lag Occurred

Replication lag occurs when the slaves cannot keep up with the updates occurring on the master. Unapplied changes accumulate in the slave’s relay logs and the version of the database on the slaves becomes increasingly different from that of the master.

Caught The Culprit

Let me take you through my journey how I crossed the river. 
First, I took the reference to multiple blogs and started gobbling my mind with possible reasons suggesting 

  • Hardware Faults (getting RAID in degraded mode)
  • MySQL Config Updates 
    • setting sync_binlog=1
    • enabling log_slave_updates
    • setting innodb_flush_log_at_trx_commit=1
    • updating slave_parallel_workers to a higher value
    • changing slave_parallel_type to support more parallel workers
  • Restarting Replication 

But unfortunately, or say, it was my benightedness towards Database Administration that I was still searching for that twig which can help me from drowning.
And finally, I found one, my DBA friend who suggested me to look for the Binary Log Format that I am using. Let’s see what it is

Binary Logging Formats

The server uses several logging formats to record information in the binary log. The exact format employed depends on the version of MySQL being used. There are three logging formats:
STATEMENT: With statement-based replication, every SQL statement that could modify data is logged on the master. Then those SQL statements are replayed on the slaves against the same dataset and in the same context. There is always less data that is to be transferred between the master and the slave. But, the data inconsistency issue between the master and the slave that creeps up due to the way this kind of replication works.
ROW: With row-based replication, every “row modification” is logged on the master and is then applied to the slave. With row-based replication, each and every change can be replicated and hence this is the safest form of replication. On a system that frequently UPDATE a large number of rows, it produces very large update logs and generates a lot of network traffic between the master and the slave.
MIXED: A third option is also available: mixed logging. With mixed logging, statement-based logging is used by default, but the logging mode switches automatically to row-based in certain cases.

Changing Binary Log Format

The Binary Log Format is updated on Master MySQL server and requires MySQL service restart to reflect. It can be done for Global, Runtime or Session.

  • set at runtime with –binlog-format=format
  • setting the global (with the SUPER privilege)
  • session value of the binlog_format server variable
mysql> SET GLOBAL binlog_format=MIXED;

mysql> SET SESSION binlog_format=ROW;

mysql> SET binlog_format=STATEMENT; 

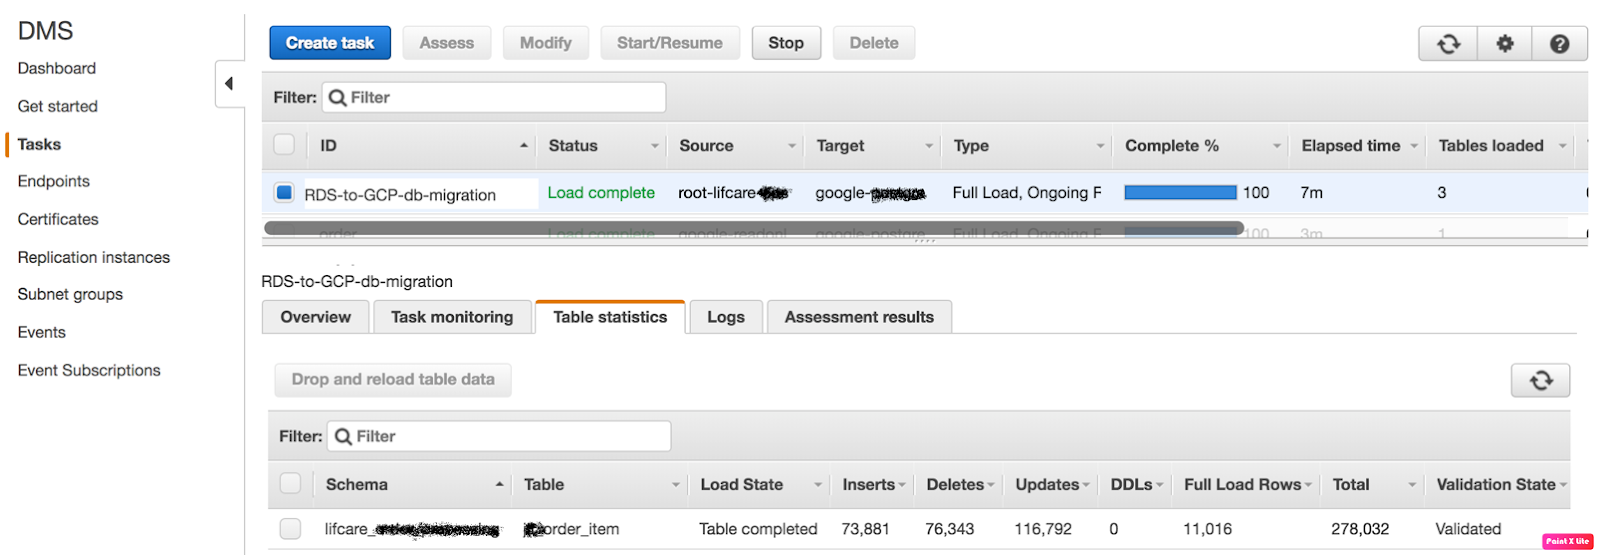
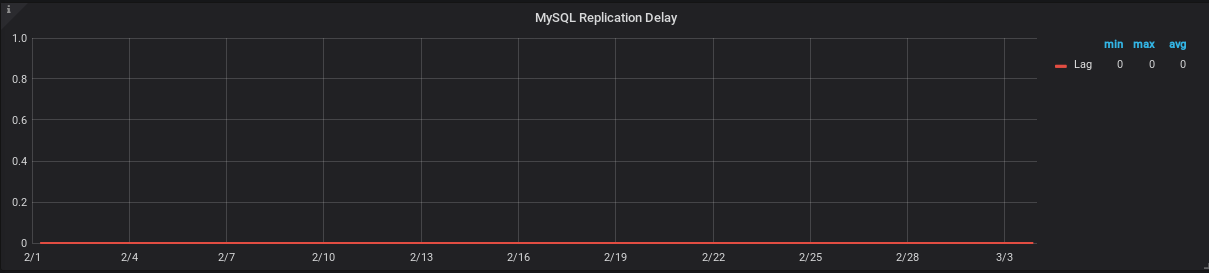
So, earlier I was using STATEMENT BinLog Format, which is default one. Since I switched to MIXED BinLog Format, I am very delighted to share the below stats.
Current status of  Master Read and Slave Execute position difference and Slave Lag (in sec), both are ZERO.

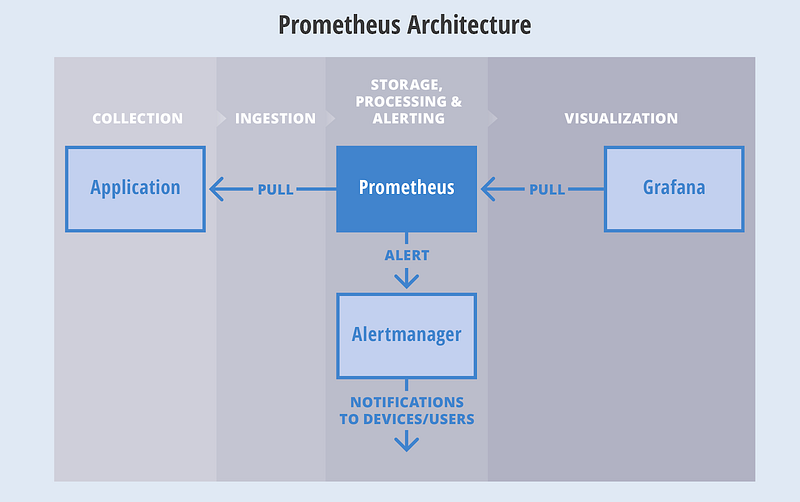
Replication Lag (in Seconds) graph for a month, powered by Prometheus-Grafana.

Now, What’s next ??

Best Practices for Writing a Shell Script

I am a lazy DevOps Engineer. So whenever I came across the same task more than 2 times I automate that. Although now we have many automation tools, still the first thing that hit into our mind for automation is bash or shell script.
After making a lot of mistakes and messy scripts :), I am sharing my experiences for writing a good shell script which not only looks good but also it will reduce the chances of error.

The things that every code should have:-
     – A minimum effort in the modification.
     – Your program should talk in itself, so you don’t have to explain it.
     – Reusability, Of course, I can’t write the same kind of script or program again and again.

I am a firm believer in learning by doing. So let’s create a problem statement for ourselves and then try to solve it via shell scripting with best practices :). I would like to have solutions in the comment section of this blog.


Problem Statement:- Write a shell script to install and uninstall a package(vim) depending on the arguments. The script should tell if the package is already installed. If no argument is passed it should print the help page.

So without wasting time let’s start for writing an awesome shell script. Here is the list of things that should always be taken care of while writing a shell script.

Lifespan of Script

If your script is procedural(each subsequent steps relies on the previous step to complete), do me a favor and add set -e in starting of the script so that the script exists on the first error. For example:-

#!/bin/bash
set -e # Script exists on the first failure
set -x # For debugging purpose

Functions

Ahha, Functions are my most favorite part of programming. There is a saying

Any fool can write code that a computer can understand. Good programmers write code that humans can understand. 

To achieve this always try to use functions and name them properly so that anyone can understand the function just by reading its name. Functions also provide the concept of re-usability. It also removes the duplicating of code, how? let’s see this

#!/bin/bash 
install_package() {
   local PACKAGE_NAME="$1"
   yum install "${PACKAGE_NAME}" -y
}
install_package "vim"

Command Sanity

Usually, scripts call other scripts or binary. When we are dealing with commands there are chances that commands will not be available on all systems. So my suggestion is to check them before proceeding.

#!/bin/bash  
check_package() {
    local PACKAGE_NAME="$1"
    if ! command -v "${PACKAGE_NAME}" > /dev/null 2>&1
    then
           printf "${PACKAGE_NAME} is not installed.\n"
    else
           printf "${PACKAGE_NAME} is already installed.\n"
    fi
}
check_package "vim"

Help Page

If you guys are familiar with Linux, you have certainly noticed that every Linux command has its help page. The same thing can be true for the script as well. It would be really helpful to include –help flag.

#!/bin/bash  
INITIAL_PARAMS="$*"
help_function() {
   {
        printf "Usage:- ./script <option>\n"
        printf "Options:\n"
        printf " -a ==> Install all base softwares\n"
        printf " -r ==> Remove base softwares\n"
    }
}
arg_checker() {
     if [ "${INITIAL_PARAMS}" == "--help" ]; then
            help_function
     fi
}
arg_checker

Logging

Logging is the most critical thing for everyone whether he is a developer, sysadmin or DevOps. Debugging seems to be impossible without logs. As we know most applications generate logs for understanding that what is happening with the application, the same practice can be implemented for shell script as well. For generating logs we have a bash utility called logger.

#!/bin/bash 
DATE=$(date)
declare DATE
check_file() {
     local FILENAME="$1"
     if ! ls "${FILENAME}" > /dev/null 2>&1
     then
            logger -s "${DATE}: ${FILENAME} doesn't exists"
     else
           logger -s "${DATE}: ${FILENAME} found successfuly"
     fi
}
check_file "/etc/passwd"

Variables

I like to name my variables in Capital letters with an underscore, In this way, I will not get confused with the function name and variable name. Never give a,b,c etc. as a variable name instead of that try to give a proper name to a variable as well just like functions.

#!/bin/bash 
# Use declare for declaring global variables
declare GLOBAL_MESSAGE="Hey, I am a global message"
# Use local for declaring local variables inside the function
message_print() {
    local LOCAL_MESSAGE="Hey, I am a local message"
    printf "Global Message:- ${GLOBAL_MESSAGE}\n"
    printf "Local Message:- ${LOCAL_MESSAGE}\n"
}
message_print

Cases

Cases are also a fascinating part of shell script. But the question is when to use this? According to me if your shell program is providing more than one functionality basis on the arguments then you should go for cases. For example:- If your shell utility provides the capability of installing and uninstalling the software.

#!/bin/bash  
print_message() {
    MESSAGE="$1"
    echo "${MESSAGE}"
}
case "$1" in
   -i|--input)
      print_message "Input Message"
      ;;
   -o|--output)
        print_message "Output Message"
        ;;
   --debug)
       print_message "Debug Message"
       ;;
    *)
      print_message "Wrong Input"
      ;;
esac

In this blog, we have covered functions, variables, the lifespan of a script, logging, help page, command sanity. I hope these topics help you in your daily life while using the shell script. If you have any feedback please let me know through comments.
Cheers Till the next Time!!!!

Can you integrate a GitHub Webhook with Privately hosted Jenkins No? Think again

Introduction

Triggering Jenkins builds automatically after every code commit is a core requirement in any continuous integration setup. Jenkins supports automated triggers through repository polling or event based notifications. While polling works, it consumes resources and introduces delays. Push based triggering through webhooks is far more efficient.

The difficulty appears when Jenkins is hosted inside a private network and the version control system is hosted on a cloud platform such as GitLab. In this scenario, GitLab cannot directly reach the Jenkins endpoint, making webhook based triggering difficult without exposing Jenkins publicly.

Webhook Relay solves this problem by acting as a secure bridge between GitLab and a privately hosted Jenkins server. This article explains how GitLab webhooks can trigger Jenkins jobs using Webhook Relay, based on real implementation experience.

Installing the Webhook Relay Agent

The Webhook Relay agent needs to run on the same machine where Jenkins is hosted or where Jenkins is reachable internally.

Below is the installation process shown as step based instructions.

# download the relay binary
curl -sSL https://storage.googleapis.com/webhookrelay/downloads/relay-linux-amd64 > relay
# make the binary executable
chmod +x relay

# move it to a directory in system path
sudo mv relay /usr/local/bin/relay

Webhook Relay service runs on a public endpoint, while this agent runs locally and listens for forwarded webhook events.

Creating a Webhook Relay Account

Create an account on the official Webhook Relay platform using the registration page shown below.

https://my.webhookrelay.com/register

After signing up, access to the Webhook Relay dashboard is provided, where authentication tokens can be generated.

Authenticating the Relay Agent

From the dashboard, create an access token. This generates a key and secret pair.

Use those credentials to authenticate the relay agent.

relay login \
-k
<your_token_key> \
-s <your_token_secret>

A successful login message confirms that the agent is connected and ready.

Creating the GitLab Repository

Create a GitLab repository for testing webhook integration. To keep the setup simple, a public repository can be used.

For reference, assume the repository name is WebhookProject.

Preparing Jenkins for GitLab Webhooks

Install the required Jenkins plugins from the plugin manager.

Navigate through the Jenkins dashboard to install
GitLab Plugin
GitLab Hook Plugin

Once installed, Jenkins becomes capable of receiving GitLab webhook events.

Creating the Jenkins Job

Create a new Jenkins job and configure it to pull source code from the GitLab repository.

Enable the option that allows Jenkins to be triggered by GitLab webhooks.

After enabling this option, Jenkins generates a webhook endpoint associated with the job. It usually follows this pattern.

http://<jenkins-host>:8080/project/<job-name>

Example shown for reference only.

Copy this endpoint, as it will be used in the forwarding configuration.

Forwarding Webhooks Using Webhook Relay

Start webhook forwarding by creating a relay bucket. This bucket acts as a routing channel between GitLab and Jenkins.

relay forward \
--bucket gitlab-jenkins \
http://<jenkins-host>:8080/project/<job-name>

Important note
Do not stop this process. Keep it running in the background.
Open a new terminal tab for further steps.

Once this command starts, the relay agent generates a public forwarding URL.

Configuring GitLab Webhook

Open the GitLab repository settings and navigate to the integrations or webhook section.

Paste the forwarding URL generated by Webhook Relay into the webhook URL field.

For initial testing, SSL verification can be disabled to avoid certificate related issues.

Save the webhook configuration.

Testing the Integration

Clone the GitLab repository locally and push a new commit.

git add .
git commit -m "test webhook trigger"
git push origin main

As soon as the push is completed, GitLab sends a webhook event. Webhook Relay receives it and forwards it to the local agent, which triggers the Jenkins job internally.

You can verify this by checking the Jenkins job build history.

Viewing Logs

GitLab webhook logs can be viewed from
Repository settings
Integrations
Webhook edit section

Webhook Relay logs are available in the Relay Logs section of the Webhook Relay dashboard.

Jenkins build logs confirm successful job execution.

Conclusion

Webhook Relay makes it possible to trigger Jenkins builds through GitLab webhooks even when Jenkins is hosted inside a private network. This approach avoids exposing Jenkins publicly while still enabling real time CI automation.

The same pattern works for GitHub and other webhook enabled platforms. With proper configuration, secure and efficient CI workflows can be achieved in restricted network environments.

Migrate your data between various Databases

Data Migration Service

 
Have you ever thought about migrating your production database from one platform to another
and dropped this idea later, because it was too risky, you were not ready to
bare a downtime?
If yes, then please pay attention because this is what we are going to perform
in this article.
A few days back we’re trying to migrate our production MySQL RDS from AWS to GCP,  SQL, and we had to migrate data without downtime, accurate and
real-time and that too without the help
of any Database Administrator.
 
After doing a bit research and evaluating few services we finally started working on AWS DMS (Data Migration Service) and figured out this is a great service to migrate a
different kind of data.
 
You can migrate your data to and from the most widely used commercial and open-source databases, and database platforms. Databases like Oracle, Microsoft SQL Server, and
PostgreSQL, MongoDB.
The source database remains fully operational during the migration,
The service supports
homogeneous migrations such as Oracle to Oracle,
and also heterogeneous migrations between different database platforms.
 

Let’s discuss some important features of AWS DMS:

 
  • Migrates the database securely, quickly and accurately.
  • No downtime required, works as schema converter as well.
  • Supports various type or database like MySQL, MongoDB, PSQL etc.
  • Migrates real-time data also synchronize ongoing changes.
  • Data validation is available to verify database.
  • Compatible with a long range of database platforms like RDS, Google SQL, on-premises etc.
  • Inexpensive (Pricing is based on the compute resources used during the migration process).
This is a typical migration scenario.
Let’s perform step by step migration:

Note: We’ve performed migration from AWS RDS
to GCP SQL, you can choose database source and
destination as per your requirement.

  1. Create replication instance:
    A replication instance initiates the connection between the source and target databases, transfers the data, cache any changes that occur on the source database during the initial data load.
    Use the fields to below to configure the parameters of your new replication instance including network and security information, encryption details, select instance class as per requirement.

    After completion, all mandatory fields click the next tab, and you will be redirected
    to Replication Instance tab.
    Grab a coffee quickly while the instance is getting ready.

    Hope you are ready with your coffee because the instance is ready now.


  2. Now we are to create two endpoints “Source” and “Target” 2.1 Create Source Endpoint:

    Click on “Run test” tab after completing all fields, make sure your Replication instance IP is whitelisted
    under security group. 2.2 Create Target Endpoint


    Click on “Run test” tab again after completing all fields, make sure your Replication instance IP is whitelisted under target DB authorization.
    Now we’ve ready Replication Instance, Source Endpoint, and Target Endpoint.
  3. Finally, we’ll create a “Replication Task” to start replication.
    Fill the fields like:
  • Task Name: any name
  • Replication Instance: The instance we’ve created above
  • Source Endpoint: The source database
  • Target Endpoint: The target database
  • Migration Type: Here I choose “Migration existing data and replication
    ongoing” because we needed ongoing changes.
 
4. Verify the task status now.
Once all the fields are completed click on the “Create task” and you will be
redirected to “Tasks”
Tab.
Check your task status
 
The task has been successfully completed now, you can verify the inserts tabs and validation tab,
The migration is done successfully if Validation State is “Validated” that means migration has been performed successfully.

AlertManager Integration with Prometheus

One day I got a call from one of my friend and he said to me that he is facing difficulties while setting up AlertManager with Prometheus. Then, I observed that most of the people face such issues while establishing a connection between AlertManager and receiver such as E-mail, Slack etc.

From there, I got motivation for writing this blog so AlertManager setup with Prometheus will be a piece of cake for everyone.

If you are new to AlertManager I would suggest you go through with our Prometheus blog.

What Actually AlertManager Is?

AlertManager is used to handle alerts for client applications (like Prometheus). It also takes care of alerts deduplicating, grouping and then routes them to different receivers such as E-mail, Slack, Pager Duty.

In this blog, we will only discuss on Slack and E-mail receivers.

AlertManager can be configured via command-line flags and configuration file. While command line flags configure system parameters for AlertManager,  the configuration file defines inhibition rules, notification routing, and notification receivers.

Architecture

Here is a basic architecture of AlertManager with Prometheus.

This is how Prometheus architecture works:-

  • If you see in the above picture Prometheus is scraping the metrics from its client application(exporters).
  • When the alert is generated then it pushes it to the AlertManager, later AlertManager validates the alerts groups on the basis of labels.
  • and then forward it to the receivers like Email or Slack.

If you want to use a single AlertManager for multiple Prometheus server you can also do that. Then architecture will look like this:-

Installation

Installation part of AlertManager is not a fancy thing, we just simply need to download the latest binary of AlertManager from here.

$ cd /opt/
$ wget https://github.com/prometheus/alertmanager/releases/download/v0.11.0/alertmanager-0.11.0.linux-amd64.tar.gz

After downloading, let’s extract the files.

$ tar -xvzf alertmanager-0.11.0.linux-amd64.tar.gz

So we can start AlertManager from here as well but it is always a good practice to follow Linux directory structure.

$ mv alertmanager-0.11.0.linux-amd64/alertmanager /usr/local/bin/

 Configuration

Once the tar file is extracted and binary file is placed at the right location then the configuration part will come. Although AlertManager extracted directory contains the configuration file as well but it is not of our use. So we will create our own configuration. Let’s start by creating a directory for configuration.

$ mkdir /etc/alertmanager/

Then the configuration file will take place.

$ vim /etc/alertmanager/alertmanager.yml

The configuration file for Slack will look like this:-

global:


# The directory from which notification templates are read.
templates:
- '/etc/alertmanager/template/*.tmpl'

# The root route on which each incoming alert enters.
route:
  # The labels by which incoming alerts are grouped together. For example,
  # multiple alerts coming in for cluster=A and alertname=LatencyHigh would
  # be batched into a single group.
  group_by: ['alertname', 'cluster', 'service']

  # When a new group of alerts is created by an incoming alert, wait at
  # least 'group_wait' to send the initial notification.
  # This way ensures that you get multiple alerts for the same group that start
  # firing shortly after another are batched together on the first
  # notification.
  group_wait: 3s

  # When the first notification was sent, wait 'group_interval' to send a batch
  # of new alerts that started firing for that group.
  group_interval: 5s

  # If an alert has successfully been sent, wait 'repeat_interval' to
  # resend them.
  repeat_interval: 1m

  # A default receiver
  receiver: mail-receiver

  # All the above attributes are inherited by all child routes and can
  # overwritten on each.

  # The child route trees.
  routes:
  - match:
      service: node
    receiver: mail-receiver

    routes:
    - match:
        severity: critical
      receiver: critical-mail-receiver

  # This route handles all alerts coming from a database service. If there's
  # no team to handle it, it defaults to the DB team.
  - match:
      service: database
    receiver: mail-receiver
    routes:
    - match:
        severity: critical
      receiver: critical-mail-receiver

receivers:
- name: 'mail-receiver'
  slack_configs:
  - api_url:  https://hooks.slack.com/services/T2AGPFQ9X/B94D2LHHD/jskljaganauheajao2
    channel: '#prom-alert'

   - name: 'critical-mail-receiver'
  slack_configs: 
  
  - api_url:   https://hooks.slack.com/services/T2AGPFQ9X/B94D2LHHD/abhajkaKajKaALALOPaaaJk  channel: '#prom-alert'

You just have to replace the channel name and api_url of the Slack with your information.

The configuration file for E-mail will look something like this:-

global:

templates:
- '/etc/alertmanager/*.tmpl'
# The root route on which each incoming alert enters.
route:
  # default route if none match
  receiver: alert-emailer

  # The labels by which incoming alerts are grouped together. For example,
  # multiple alerts coming in for cluster=A and alertname=LatencyHigh would
  # be batched into a single group.
  # TODO:
  group_by: ['alertname', 'priority']

  # All the above attributes are inherited by all child routes and can
  # overwritten on each.

receivers:
- name: alert-emailer
  email_configs:
  - to: 'receiver@example.com'
    send_resolved: false
    from: 'sender@example.com'
    smarthost: 'smtp.example.com:587'
    auth_username: 'sender@example.com'
    auth_password: 'IamPassword'
    auth_secret: 'sender@example.com'
    auth_identity: 'sender@example.com'

In this configuration file, you need to update the sender and receiver mail details and the authorization password of the sender.

Once the configuration part is done we just have to create a storage directory where AlertManger will store its data.

$ mkdir /var/lib/alertmanager

Then only last piece which will be remaining is my favorite part i.e creating service 🙂

$ vi /etc/systemd/system/alertmanager.service

The service file will look like this:-

[Unit]
Description=AlertManager Server Service
Wants=network-online.target
After=network-online.target

[Service]
User=root
Group=root
Type=Simple
ExecStart=/usr/local/bin/alertmanager \
    --config.file /etc/alertmanager/alertmanager.yml \
    --storage.tsdb.path /var/lib/alertmanager

[Install]
WantedBy=multi-user.target

Then reload the daemon and start the service

$ systemctl daemon-reload
$ systemctl start alertmanager
$ systemctl enable alertmanager

Now you are all set to fire up your monitoring and alerting. So just take a beer and relax until Alert Manager notifies you for alerts. All the best!!!!