Table of Contents
Introduction
- Kubernetes clusters are highly dynamic, and issues can appear at any time from pod scheduling failures to container crashes.
- Kubernetes events provide real-time insights into such problems, but managing and analysing these events at scale can be challenging.
- In this blog, we will learn how to monitor Kubernetes events using Open Telemetry Collector and visualize them in Grafana via Loki.
Why We Need Kubernetes Events Monitoring (and Why via Open Telemetry)
1. Kubernetes events provide the earliest signals when something goes wrong in a cluster, such as:
- scheduling failures
- image pull errors
- CrashLoopBackOff
2. They help us quickly understand
- What happened
- When it happened
- Which Kubernetes object was affected
Why Use Open Telemetry for Events?
- Kubernetes events are notifications that record significant changes and state transitions within the cluster such as pod creation, failures, or terminations.
The complete flow diagram for this process is shown below.
What Are Kubernetes Events?
- Kubernetes events are notifications that record significant changes and states within the cluster such as pod creation, failures, or terminations.
Common event types:
- PodCreated
- FailedScheduling
- ImagePullBackOff
- CrashLoopBackOff
- Probe failures
Architecture Flow Diagram :
The following diagram shows how Kubernetes events flow from the cluster to Grafana using Open Telemetry and Loki.
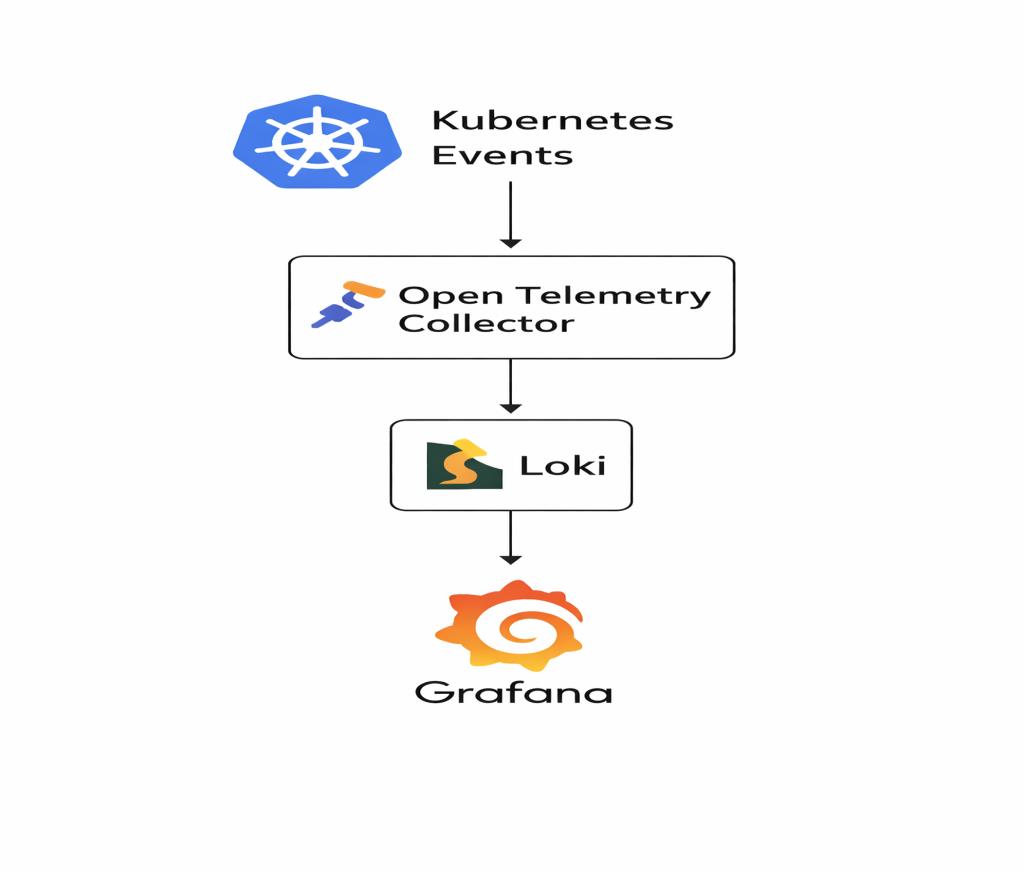
The following flow explains how Kubernetes events move from the cluster to Grafana using OpenTelemetry and Loki.
- Kubernetes creates events
Kubernetes generates events for every important activity happening in the cluster (like pod start, pod failure, scheduling issues, image pull errors, etc.)
- OTel Collector watches these events
The Open Telemetry Collector continuously watches all Kubernetes events in real time.
- Collector receives events through receivers
- k8s_events receiver → reads all basic events
- k8sobjects receiver → watches events from the events API
- Events are processed
The collector processes incoming events using processors
- Batch processor – Groups events before exporting
- Resource processor – Adds metadata such as cluster name and service name
- Collector exports events to Loki
The processed events are then pushed to Loki as log entries using the Loki exporter.
- Loki stores these events
Loki stores all the incoming events like log data.
- Grafana shows the events
You can query these stored events in Grafana and visualize them using simple log queries.
(for example: {service=”k8s-events”})
Prerequisite
Before starting the setup, ensure you have:
- A running Kubernetes cluster
- Helm installed
- Loki and Grafana already deployed
- Cluster access with sufficient permissions
Setup: Deploy Kubernetes Events Monitoring Using Helm
STEP-1
Prepare Helm Chart
Chart.yml.
apiVersion: v2

name: otel-k8s-events

description: OpenTelemetry Collector - Kubernetes Events exporter (Helm chart)

type: application

version: 0.1.0

appVersion: "0.1.0"

keywords:

  - opentelemetry

  - k8s

  - events
This file defines:
- Chart name
- Chart version
- Application version
- Description and keywords
values.yaml
otelCollector:

  image:
    repository: otel/opentelemetry-collector-contrib
    tag: 0.123.0

  clusterName: "cluster-name"

  resources:
    requests:
      cpu: 50m
      memory: 128Mi
    limits:
      cpu: 200m
      memory: 256Mi

exporters:
  loki:
    endpoint: "loki-end-point-url"

loadbalancerCollectorP0Sa:
  serviceAccount:
    annotations: {}
This file allows customization of:
- OpenTelemetry Collector image and version
- Cluster name for tagging events
- Loki endpoint for exporting events
- CPU and memory requests/limits
STEP-2
Install the Helm Chart
Create a namespace and install the chart
helm install otel-k8s-events. -n otel-events --create-namespace
For future updates:
helm upgrade otel-k8s-events . -n otel-events -f values.yaml
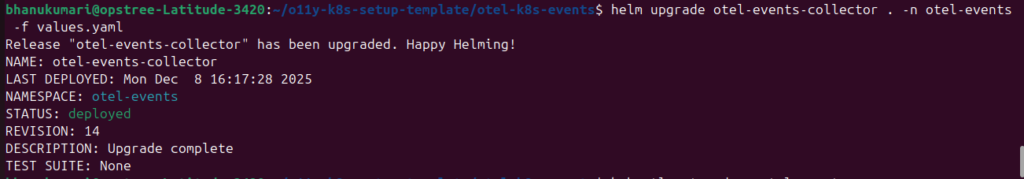
(Make sure you run these commands from inside the chart directory)
STEP-3
Verify Collector Pod.
Check whether the collector pod is running

STEP: 4
Check Collector Logs
You should see Kubernetes event data in the logs, for example
kubectl logs -n otel-events <collector-pod>
You should see event logs like:
{
  "name": "gke-opstree-o11y-default-pool-d57e4c76-h2cz",
  "status": {
    "conditions": [
      { "type": "MemoryPressure", "status": "False" },
      { "type": "DiskPressure", "status": "False" },
      { "type": "PIDPressure", "status": "False" },
      { "type": "Ready", "status": "True" }
    ]
  }
}
STEP: 5
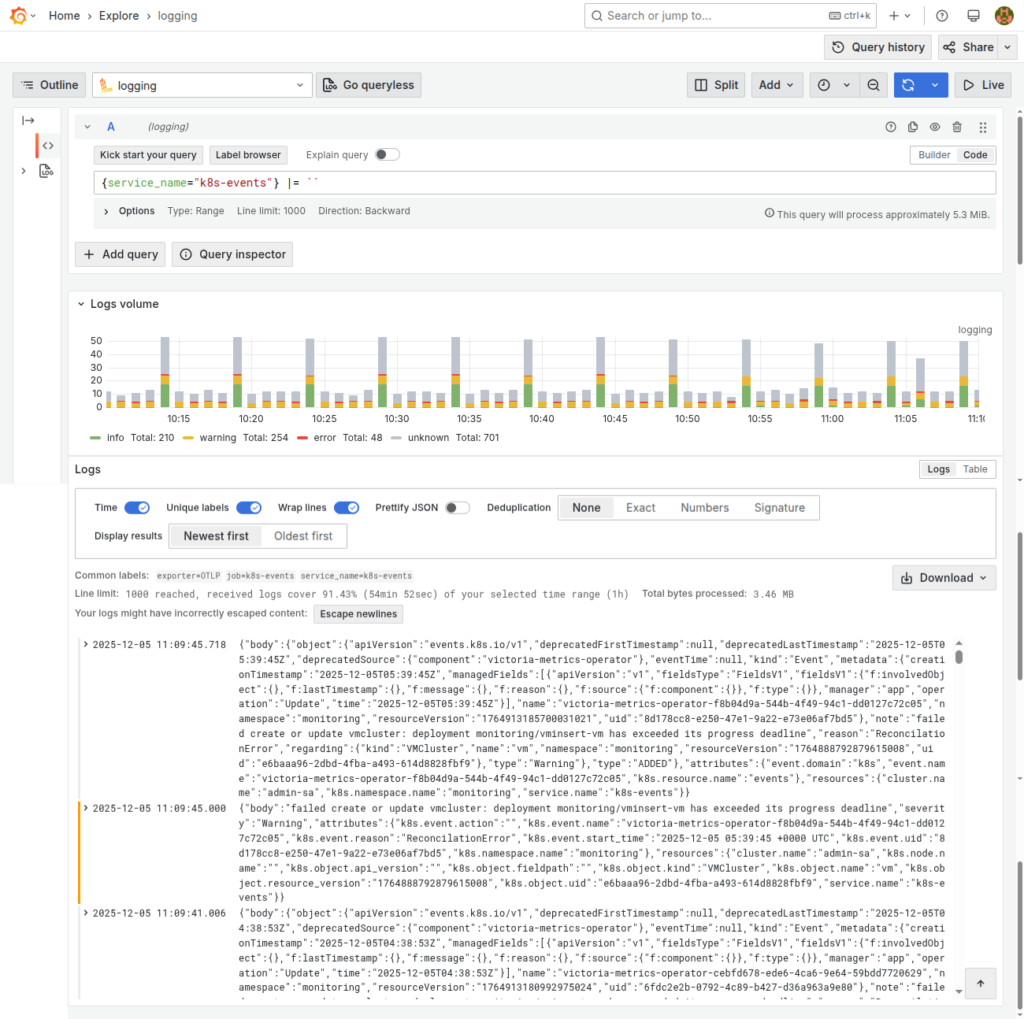
Verify Events in Grafana
- Open Grafana and navigate to the Explore section.
- In the query bar, enter the following Loki query:
{service="k8s-events"}
3. If your setup is correct, you should see Kubernetes events appearing as logs like this.
Conclusion
Kubernetes events provide critical insights into cluster behaviour, but they are often short-lived and difficult to analyse.
By using OpenTelemetry Collector with Loki and Grafana, we can:
- Collect Kubernetes events centrally
- Retain them for longer durations
- Easily search and analyse cluster issues
This approach reduces MTTR and significantly improves Kubernetes observability.
Related Searches
- Container Scanning Tools: Why They Matter In DevSecOps And How To Choose The Best One
- What Is DevSecOps? A Complete Guide To Secure Software Delivery
- BuildPiper- The ideal Kubernetes & Microservices Application Delivery Platform for your Business!