Introduction
Logs play a critical role in any application or system. They provide deep visibility into what the application is doing, how requests are processed, and what caused an error. Depending on how logging is configured, logs may contain transaction history, timestamps, request details, and even financial information such as debits or credits.
In enterprise environments, applications usually run across multiple hosts. Managing logs across hundreds of servers can quickly become complex. Debugging issues by manually searching log files on multiple instances is time consuming and inefficient. This is why centralizing logs is considered a best practice.
Recently, I encountered a common challenge in AWS environments where application logs need to be retained from instances running behind an Auto Scaling Group. This blog explains a practical solution to ensure logs are preserved even when instances are terminated.
Problem Scenario
Assume your application writes logs to the following directory on a Windows instance.
Traffic to the application is variable. At low traffic, two EC2 instances may be sufficient. During peak traffic, the Auto Scaling Group may scale out to twenty or more instances.
When traffic increases, new EC2 instances are launched and logs are generated normally. However, when traffic drops, Auto Scaling triggers scale-down events and terminates instances. When an instance is terminated, all logs stored locally on that instance are lost.
This makes post-incident debugging and auditing difficult.
Solution Overview
The goal is to synchronize logs from terminating EC2 instances before they are fully removed.
This solution uses AWS services to trigger a PowerShell script through AWS Systems Manager at instance termination time. The script archives logs and uploads them to an S3 bucket with identifying information such as IP address and date.
To achieve this, two prerequisites are required.
-
Systems Manager must be able to communicate with EC2 instances
-
EC2 instances must have permission to write logs to Amazon S3
Environment Used
For this setup, the following AMI was used.
Step 1 Configuring Systems Manager Access on EC2
SSM Agent is installed by default on Windows Server 2016 and on Windows Server 2003 to 2012 R2 AMIs published after November 2016.
For older Windows AMIs, EC2Config must be upgraded and SSM Agent installed alongside it.
The following PowerShell script upgrades EC2Config, installs SSM Agent, and installs AWS CLI.
Use this script only for instructional and controlled environments.
PowerShell Script to Install Required Components
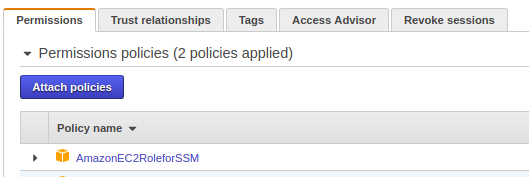
IAM Role for Systems Manager
The EC2 instance must have an IAM role that allows it to communicate with Systems Manager.
Attach the following managed policy to the instance role.
Once attached, the role should appear under the instance IAM configuration.
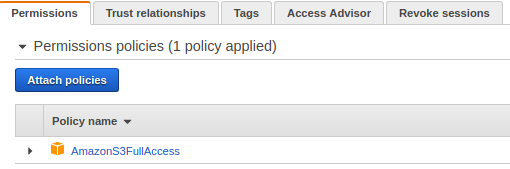
Step 2 Allowing EC2 to Write Logs to S3
The EC2 instance also needs permission to upload logs to S3.
Attach the following policy to the same IAM role.
In production environments, it is recommended to scope this permission to a specific bucket.
PowerShell Script for Log Archival and Upload
Save the following script as shown below.
This script performs the following actions.
-
Creates a date-stamped directory
-
Archives application logs
-
Uploads the archive to an S3 bucket
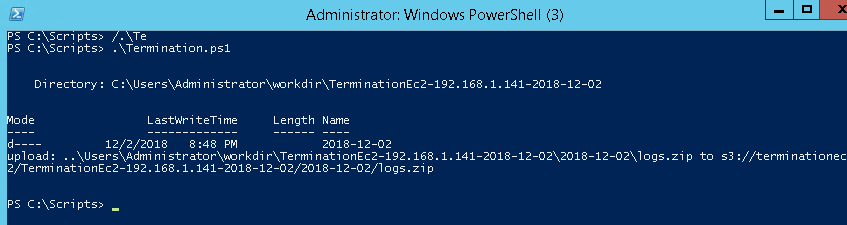
Log Synchronization Script
Once executed manually, the script should complete successfully and upload logs to the S3 bucket.

Running the Script Using Systems Manager
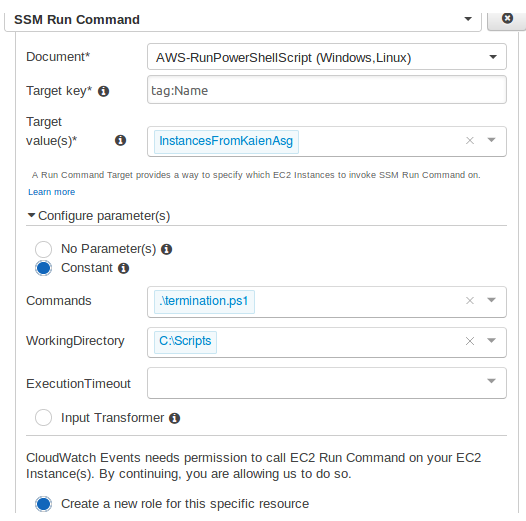
To automate execution, run this script using Systems Manager Run Command.
Select the target instance and choose the document.
Configure the following.
Auto Scaling Group Preparation
Ensure the AMI used by the Auto Scaling Group includes all the above configurations.
Create an AMI from a configured EC2 instance and update the launch configuration or launch template.
For this tutorial, the Auto Scaling Group is named.
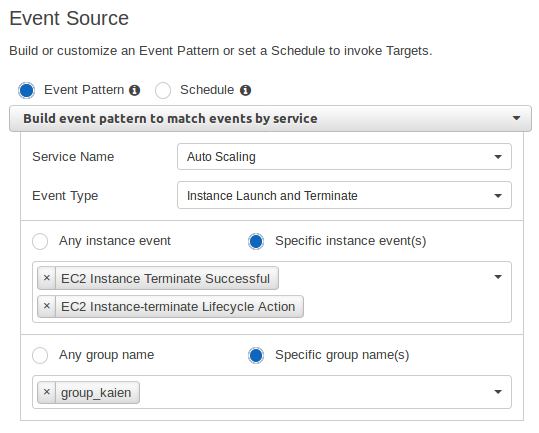
Configuring CloudWatch Event Rule
Create a CloudWatch Event rule to trigger when an instance is terminated.
Event Pattern
Event Target Configuration
Set the target as Systems Manager Run Command.
This ensures that whenever an instance is terminated, the PowerShell script runs and synchronizes logs to S3 before shutdown.
Validation
Trigger scale-out and scale-down events by adjusting Auto Scaling policies.
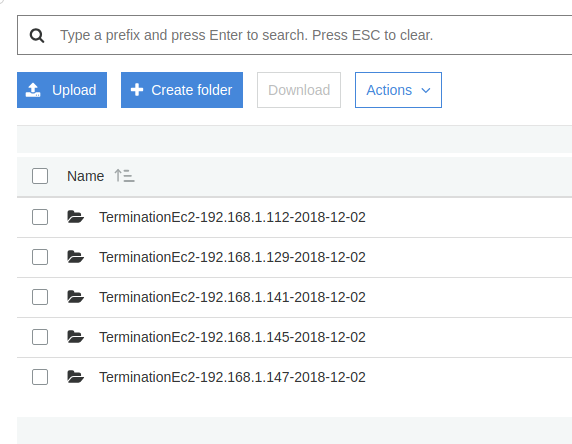
When instances are terminated, logs should appear in the S3 bucket with correct date and instance identifiers.
Conclusion
This setup ensures that application logs are safely preserved even when EC2 instances are terminated by an Auto Scaling Group. Logs are archived with proper timestamps and instance information, making debugging and auditing much easier.
With this approach, log retention is automated, reliable, and scalable for enterprise AWS environments.
Stay tuned for more practical infrastructure solutions.